You will get a professional Finance Dashboard in Power BI - Assets, Liabilities & Equity
Rising Talent
Rising Talent
Project details
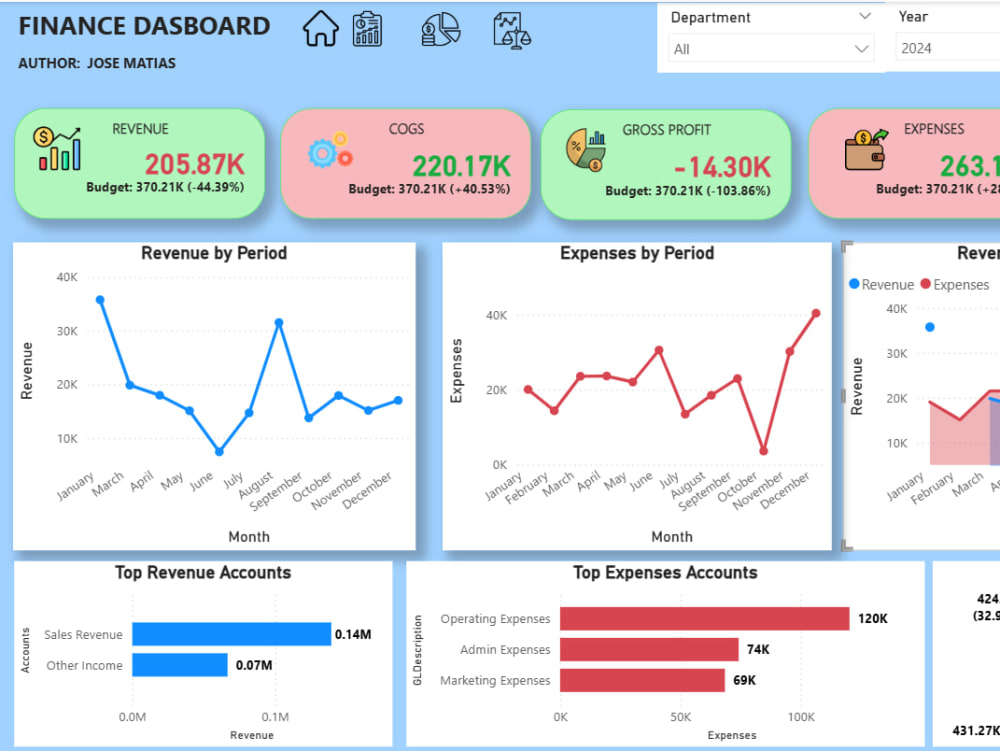
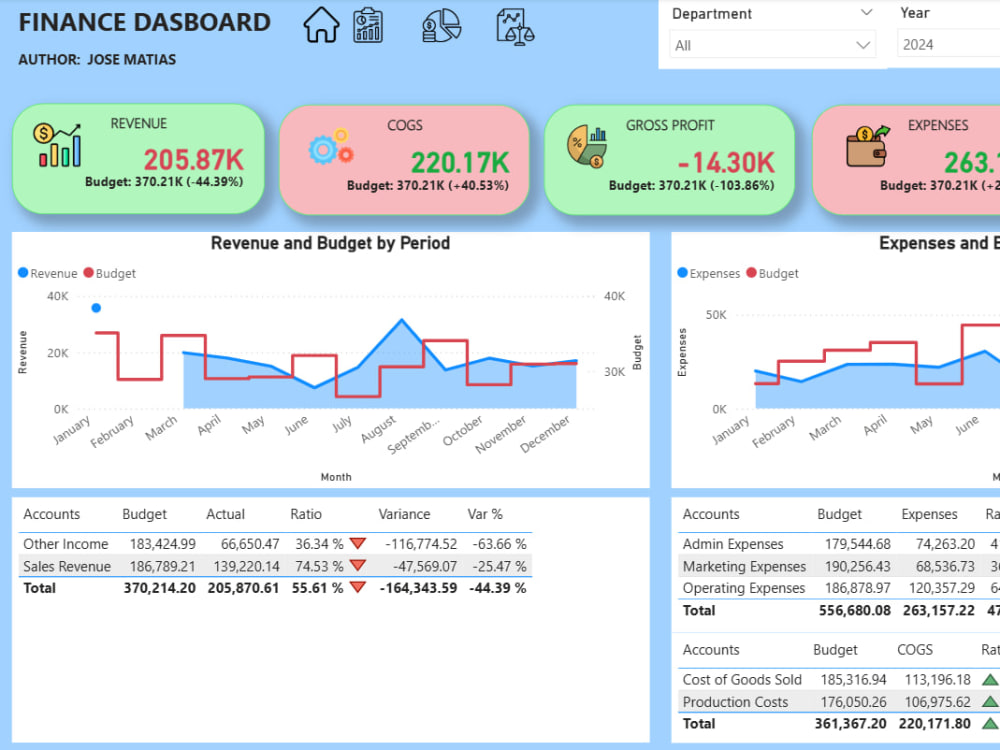
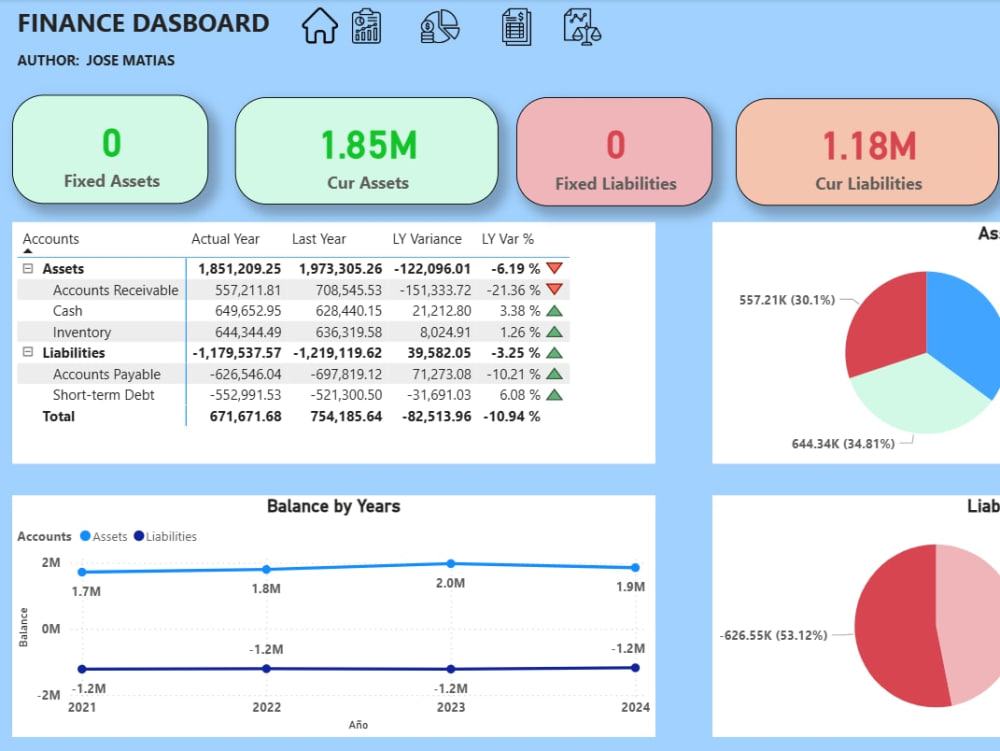
I will build a professional, dynamic, and insightful Finance Dashboard in Power BI to provide a complete view of your company's financial position. This dashboard is designed for finance teams, executives, and decision-makers who need clarity and control over their key financial indicators.
📌 Key Features
🔹 Assets Overview
Real-time summary of current and non-current assets
Monthly and YTD trends
Drill-through to asset-level detail
🔹 Liabilities & Equity
Breakdown of short-term and long-term liabilities
Retained earnings and capital movement
Debt-to-equity and other financial ratios
🔹 GL Account Insights
Structured by General Ledger (GL) accounts
Grouped by category (Assets, Liabilities, Equity)
Filterable by Cost Center, Department, or Business Unit
🔹 Comparative Views
Current vs. Previous Periods
Actual vs. Budget
Monthly / Quarterly / Annual breakdowns
🔹 Key Metrics & Ratios
Working Capital
Debt Ratio
Equity Ratio
Revenue vs. Budget %
🔹 Interactive Design
Filter by time range, account group, or cost center
Hover tooltips and drill-downs
Clear, modern layout
📌 Key Features
🔹 Assets Overview
Real-time summary of current and non-current assets
Monthly and YTD trends
Drill-through to asset-level detail
🔹 Liabilities & Equity
Breakdown of short-term and long-term liabilities
Retained earnings and capital movement
Debt-to-equity and other financial ratios
🔹 GL Account Insights
Structured by General Ledger (GL) accounts
Grouped by category (Assets, Liabilities, Equity)
Filterable by Cost Center, Department, or Business Unit
🔹 Comparative Views
Current vs. Previous Periods
Actual vs. Budget
Monthly / Quarterly / Annual breakdowns
🔹 Key Metrics & Ratios
Working Capital
Debt Ratio
Equity Ratio
Revenue vs. Budget %
🔹 Interactive Design
Filter by time range, account group, or cost center
Hover tooltips and drill-downs
Clear, modern layout
Data Tool
Microsoft Power BIWhat's included
| Service Tiers |
Starter
$10
|
Standard
$50
|
Advanced
$100
|
|---|---|---|---|
| Delivery Time | 1 day | 2 days | 3 days |
Number of Revisions | 2 | 4 | Unlimited |
Number of Graphs/Charts | 6 | 24 | 60 |
Data Source Connectivity | |||
Web Embedding | - | - | |
Interactive/Animated Visuals |
Optional add-ons
You can add these on the next page.
Fast Delivery
+$10 - $30
Additional Graph/Chart
+$10
1 review
(1)
(0)
(0)
(0)
(0)
This project doesn't have any reviews.
VG
Vanshika G.
Oct 8, 2025
Fluent Spanish (Latin America) Speakers for Recording Projects
About Jose Alfredo
System Engineer | Power BI | Excel | SQL Server | Data Entry Expert
100%
Job Success
Santo Domingo, Dominican Republic - 5:05 am local time
Fluency isn't just a word for me; it's my language proficiency. As a native Spanish speaker, I excel as a writer, translator, transcriber, and editor. Moreover, my fluency in English opens doors to seamless communication and comprehension across languages.
With a track record of crafting 50-page essays for clients and academic assignments, my writing prowess knows no bounds. Typing at a swift 50 words per minute, I ensure efficiency without compromising on quality or accuracy.
But my capabilities don't end there. Need a software optimized or programmed? I'm your go-to pro. Creating, refining, and managing databases? Consider it done. Documenting software to the tee? That's another one of my specialties.
When you work with me, you're partnering with a professional who's not only responsible but also committed to punctuality and meeting the exacting standards of each project. Your deadlines are sacred to me, and your satisfaction is my benchmark.
Let's turn your freelance project into a masterpiece of technology and language. Reach out today to collaborate with a true master of the tech realm.
Steps for completing your project
After purchasing the project, send requirements so Jose Alfredo can start the project.
Delivery time starts when Jose Alfredo receives requirements from you.
Jose Alfredo works on your project following the steps below.
Revisions may occur after the delivery date.
Understand your data and goals
I’ll review your dataset(s), business context, and reporting needs to ensure the dashboard aligns with your objectives.
Connect to your data source
I’ll establish a secure and reliable connection to your database, Excel file, CRM (e.g., Business Central, Bitrix24), or other source.