You will get a Reactjs d3 Data visualization widget


Project details
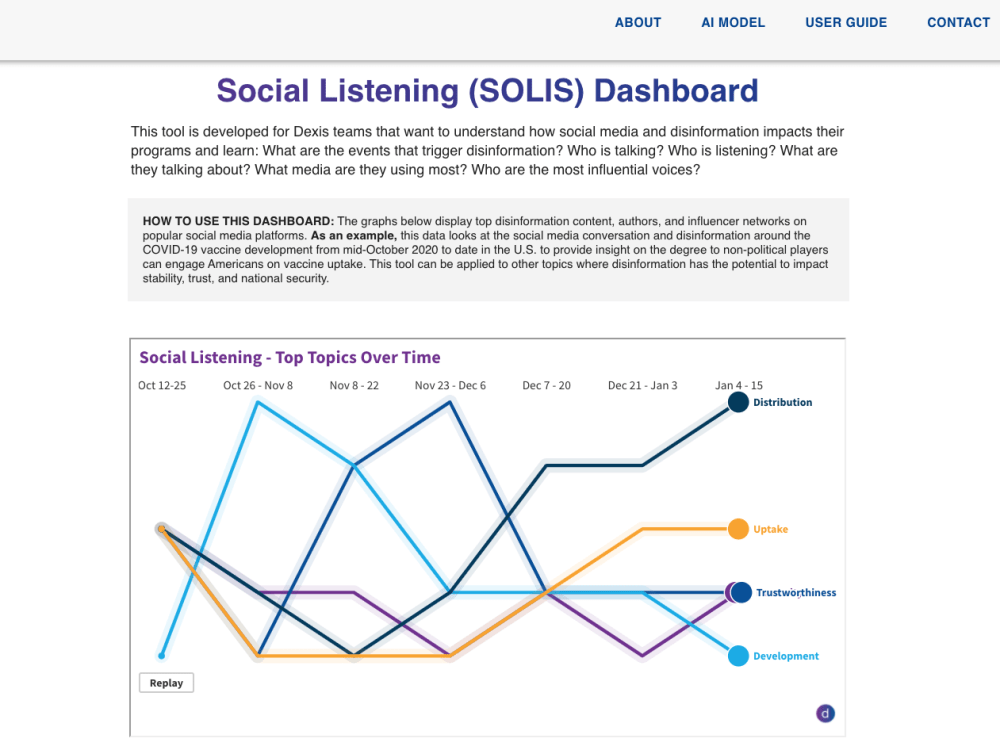
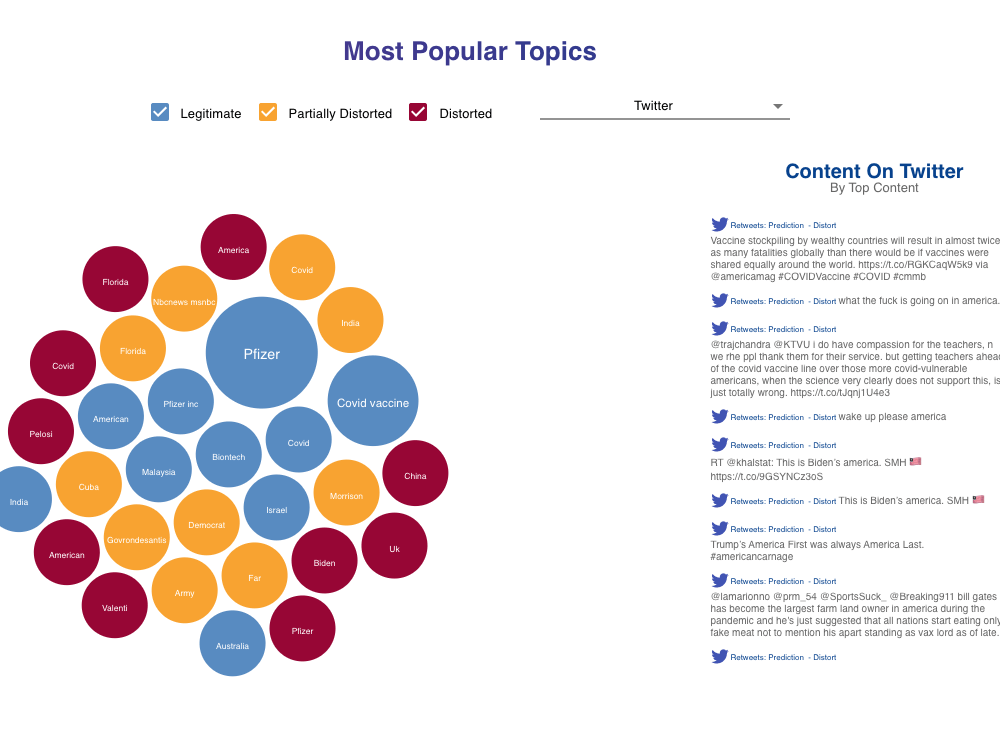
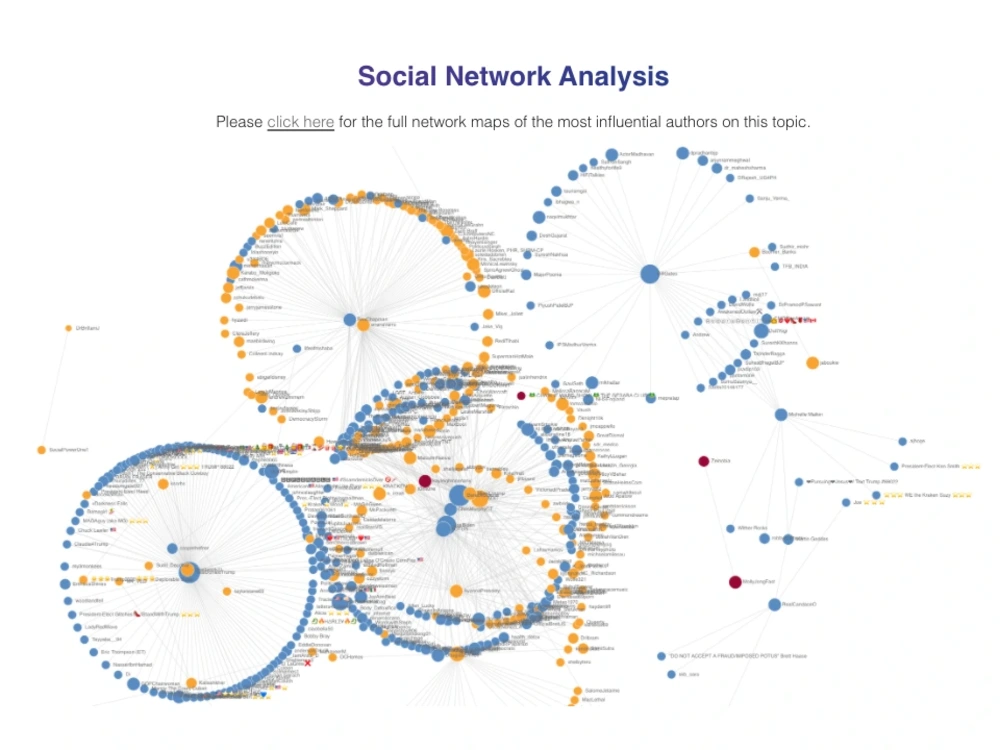
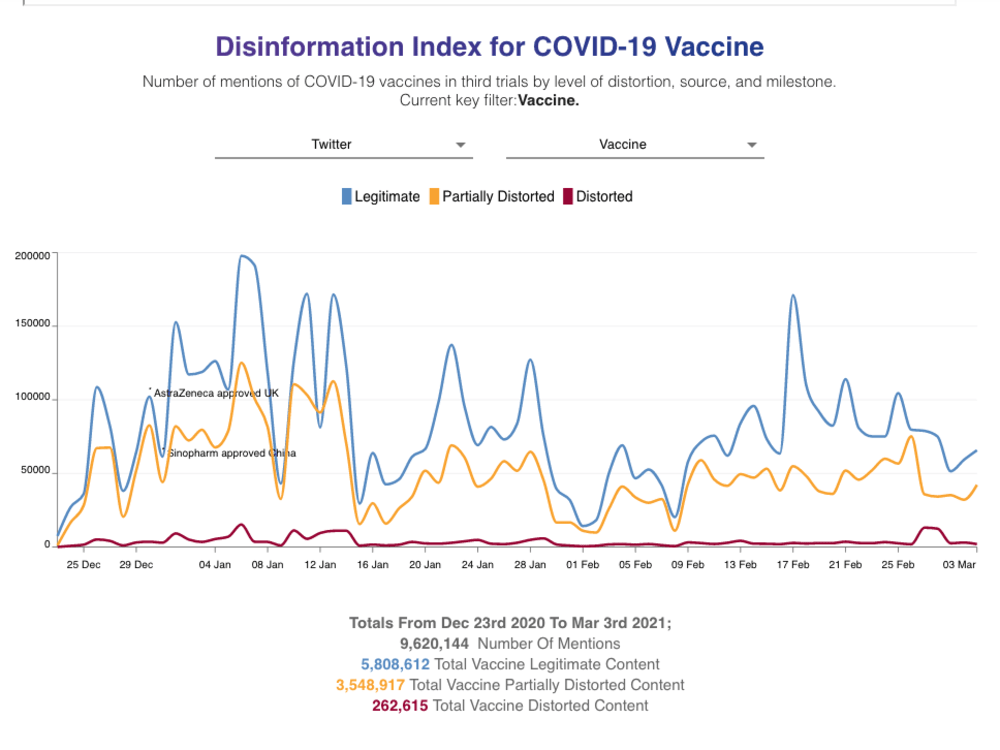
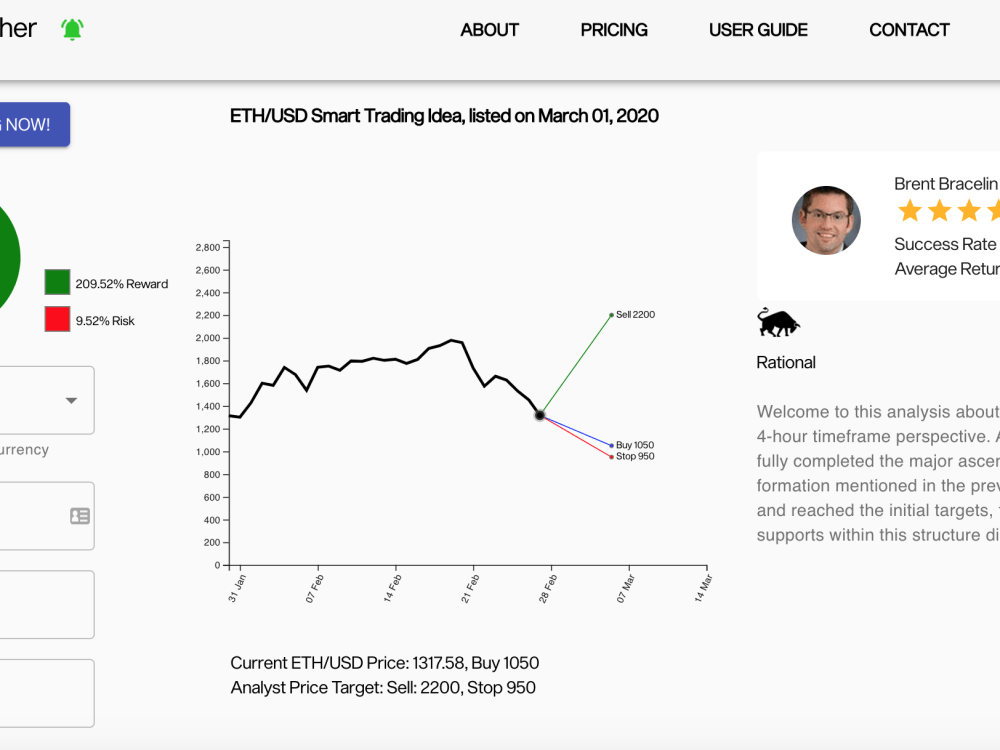
Hello. You will get a polished React.js d3 chart or widget, Web App, or a dashboard that includes a d3.js chart to help your company tell your story better.
Why use data visualizations?
• Business intelligence with data visualization capabilities has been popular and offer an ROI of $13.01 back on every dollar spent
• A picture is worth 1000 words!
• 97% believe information is reliable shown by a graph vs words & numbers.
React allow HTML, CSS, and JavaScript capabilities as well as plays nicely with other APIs and add-ons to help animate the view and render the DOM only when needed thanks to React VDOM capability.
I have years of experience and created many types of charts using d3.js and my specialty is integrating these charts into a React project. Additionally, I have experience integrating all the main chart libraries out there such as Recharts, Visx, Victory, Nivo, React-vis, and connect your data sources and create APIs.
I used best practices and my work is original, customized, and high quality.
Programming Languages
HTML & CSS, JavaScript, TypeScriptCoding Expertise
Cross Browser & Device Compatibility, PSD to HTML, Performance OptimizationWhat's included
| Service Tiers |
Starter
$997
|
Standard
$1,997
|
Advanced
$4,997
|
|---|---|---|---|
| Delivery Time | 7 days | 14 days | 30 days |
Number of Revisions | 1 | 2 | 2 |
Number of Pages | 1 | 2 | 5 |
Design Customization | |||
Content Upload | |||
Responsive Design | |||
Source Code |
Optional add-ons
You can add these on the next page.
Fast Delivery
+$500 - $2,000
6 reviews
(6)
(0)
(0)
(0)
(0)
This project doesn't have any reviews.
MW
Michael W.
Oct 18, 2025
Sigmanomics.com speed and updates
Will surely use in near future
CK
Chase K.
May 24, 2024
Provide mentoring and guidance in utilization of d3.zoom functionality.
I worked with Eli in building a stock chart using d3.js
Eli was great to work with, extremely flexible. Eli has routinely provided explanation on components he built for me in d3. Very communicative. He has also taken initiative on a very small component that I did not specifically request but knew I needed as It provided additional necessary functionality. Eli is adept in modularizing code to allow for more flexibility in change of code for future adaptations/changes.
5 stars! would recommend to anyone!
CK
Chase K.
Apr 22, 2024
Provide mentoring and guidance in utilization of d3.zoom functionality.
Elad is great, an excellent dev and very helpful.
JD
Jac D.
Sep 1, 2022
Academic Dashboard
DS
Dave S.
Mar 21, 2022
JavaScript Data Visualization Proof of Concept Project
Great experience with Eli, perfect for our proof of concept.
About Eli Elad
React Next.js d3.js Data Visualization Expert
100%
Job Success
New York, United States - 6:51 am local time
I offer data visualization development services, specializing in d3.js. I can create everything from standalone d3.js charts and React Next.js widgets to complete dashboards and web applications. I also have experience integrating d3.js with other charting libraries like Chart.js, Highcharts, Mapbox, and Visx. My expertise extends to full-stack development using technologies like NestJS, Prisma, and PostgreSQL.
About Eli Elrom:
Eli Elrom is a technical coach, author, and consultant with experience working with Fortune 500 companies (including AT&T, HBO, Viacom, NBC Universal, and Weight Watchers) and startups. He has also organized sold-out technology conferences in New York City and authored several technical books. Beyond technology, Eli is a PADI diving instructor and a pilot.
I can help you bring your data to life with custom visualizations. My services include:
- Creating and publishing standalone d3.js charts.
- Developing reusable d3.js widgets for React Next.js applications.
- Building complete d3.js dashboards.
- Integrating d3.js with other visualization libraries like Chart.js, Highcharts, Mapbox, and Visx.
- Developing full-stack web applications with d3.js integration, using technologies like NestJS, Prisma, and PostgreSQL.
Steps for completing your project
After purchasing the project, send requirements so Eli Elad can start the project.
Delivery time starts when Eli Elad receives requirements from you.
Eli Elad works on your project following the steps below.
Revisions may occur after the delivery date.
Data layer
• Get the data • Set the Data • Process the data
View layer
• Integrate to React’s lifecycle hooks • Draw a chart • Style the component