You will get a Statistical data analysis, data visualization in Python, React, Powerbi

Project details
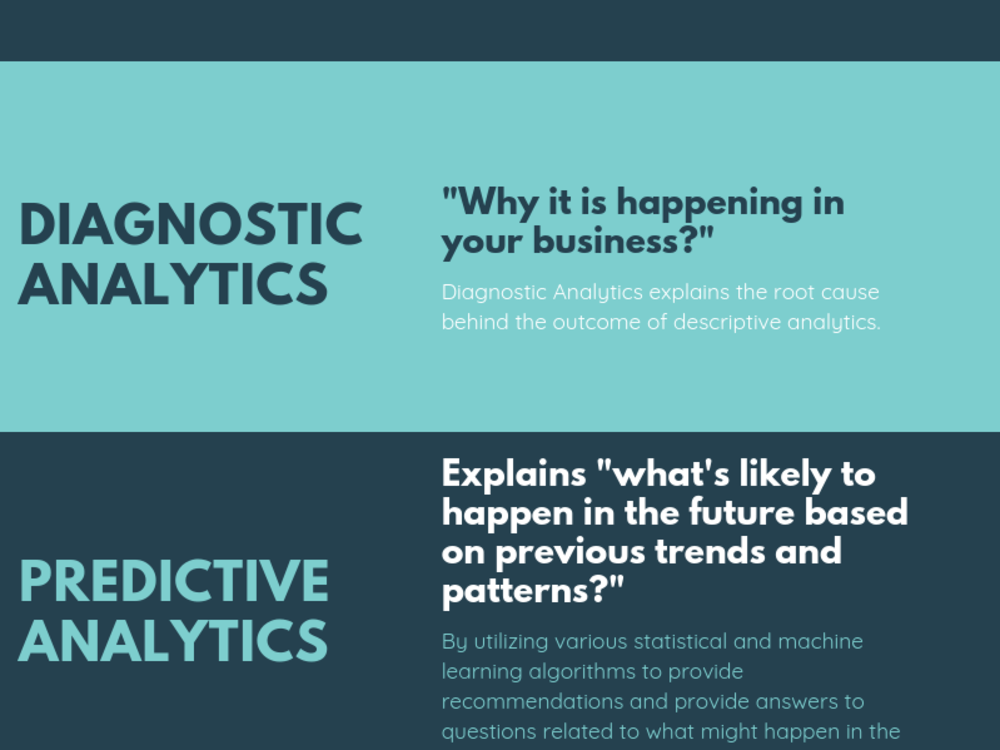
I will perform data analysis, data Visualization, and data cleaning. In Data Analysis I will perform the following analysis:
1) Statistical
2) Descriptive
3) Prescriptive
4) Quantitative
5) Market Research.
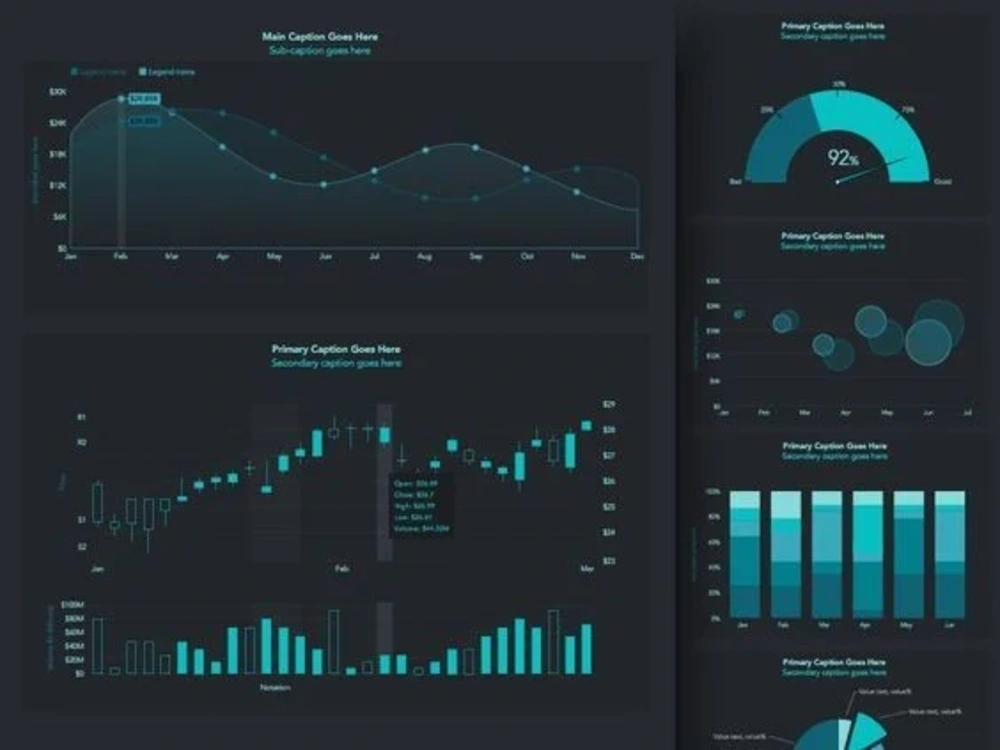
I can also create Dashboards by using React.js, Powerbi and Python. I will also deploy them on cloud services.
I can create dashboards that can get data from databases or Apis. These Dashboards will help you to understand your businesses and with the help of these APIs, you can take further actions to enhance your businesses.
My tools will be:
Python, React, R, SQL, MYSQL, Excel, Powerbi , Tensorflow, GGPLOT2, D3.JS, Pandas, Numpy, Beautiful Soup, Apache Spark, Jupyter Notebook etc.
I only believe in Quality work. I will give my best to fulfill your requirements. Communication is the best key to understanding others' requirements and for that, we can do Video chats and we can create documentation on projects. Let me know if you are interested.
1) Statistical
2) Descriptive
3) Prescriptive
4) Quantitative
5) Market Research.
I can also create Dashboards by using React.js, Powerbi and Python. I will also deploy them on cloud services.
I can create dashboards that can get data from databases or Apis. These Dashboards will help you to understand your businesses and with the help of these APIs, you can take further actions to enhance your businesses.
My tools will be:
Python, React, R, SQL, MYSQL, Excel, Powerbi , Tensorflow, GGPLOT2, D3.JS, Pandas, Numpy, Beautiful Soup, Apache Spark, Jupyter Notebook etc.
I only believe in Quality work. I will give my best to fulfill your requirements. Communication is the best key to understanding others' requirements and for that, we can do Video chats and we can create documentation on projects. Let me know if you are interested.
Data Tool
PythonWhat's included $15
These options are included with the project scope.
$15
- Delivery Time 5 days
- Number of Revisions Unlimited
- Number of Graphs/Charts 10
- Number of Variations 3
- Data Source Connectivity
- Web Embedding
- Interactive/Animated Visuals
About Abbass
Python | Machine Learning | data visualization & data analysis
Opole, Poland - 5:50 am local time
Responsibilities:
1:Understand and use computer science fundamentals, including data structures, data visualization, algorithms, computability and complexity, and computer architecture.
2:Use exceptional mathematical skills, in order to perform computations and work with the algorithms involved in this type of programming.
3:use power bi, google data studio and python visualization graphs to understand and analyze data.
4:Produce project outcomes and isolate the issues that need to be resolved, in order to make programs more effective.
5:Build algorithms based on statistical modeling procedures and build and maintain scalable machine learning solutions in production.
6:Use data modeling and evaluation strategy to find patterns and predict unseen instances.
7:Apply machine learning algorithms and libraries.
8:Analyze large, complex datasets to extract insights and decide on the appropriate technique.
9:Research and implement best practices to improve the existing machine learning infrastructure.
Steps for completing your project
After purchasing the project, send requirements so Abbass can start the project.
Delivery time starts when Abbass receives requirements from you.
Abbass works on your project following the steps below.
Revisions may occur after the delivery date.
Communication
In this step, Client will send the requirements.
Client purchases the project