You will get a stock market screener and software tool with candlestick chart of data


Project details
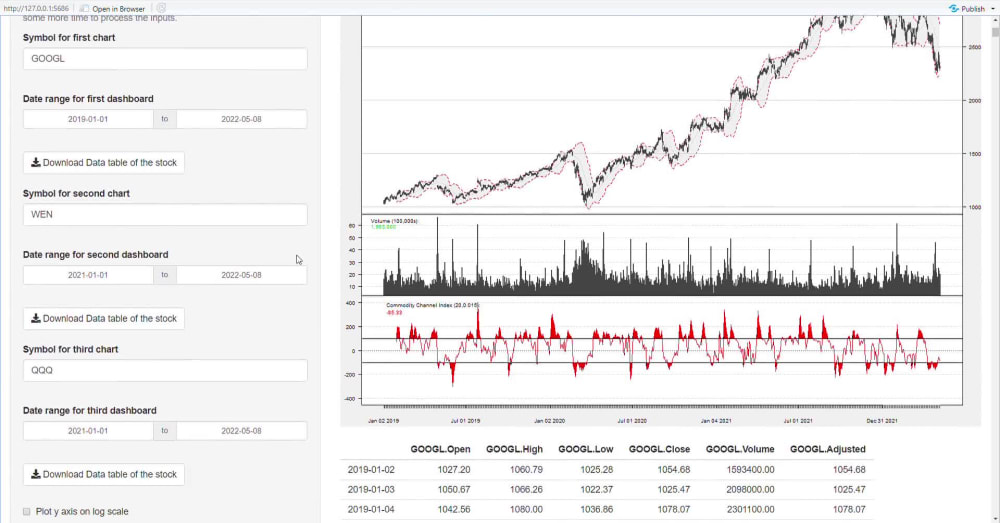
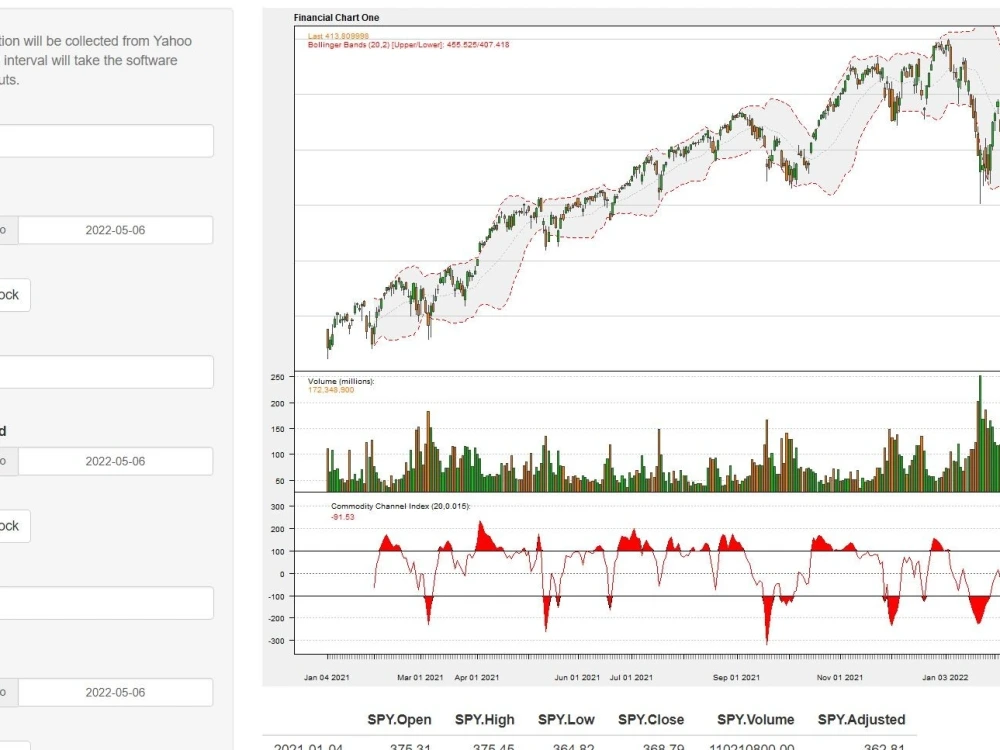
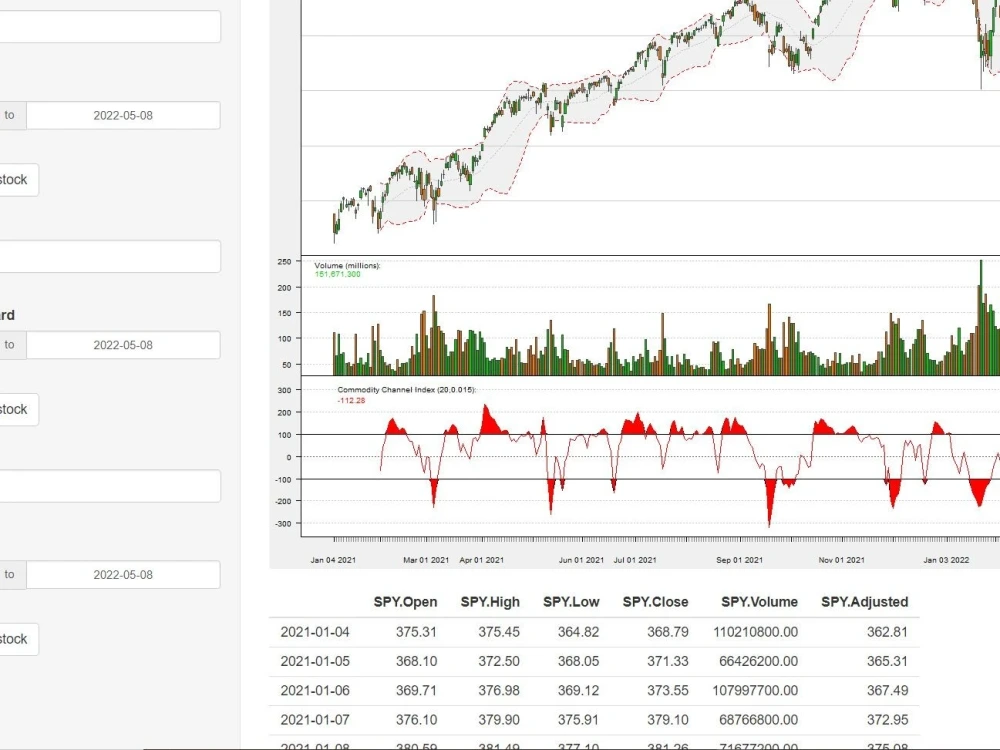
Data mining and extraction of stock market data have never been easier thanks to this software. The software is designed in R Shiny and other related libraries in R. Data is extracted from Yahoo Finance website and is displayed in the mainframe of the software and can also be downloaded to your computer as an excel file. The data of each stock mined includes open, high, low, close, adjusted close prices, and the volume of trade for each day. Data is extracted on a day-to-day basis. The custom number of stock symbols you can extract at the same time is set to 3 but can be customized to fit your organization's needs. The date range can also be customized to meet your data needs. The software also generated a candlestick chart to give meaning to the raw data and has also been fitted with a volume column graph chart, Bollinger band index Chanel and a commodity index Chanel to show trends of the data extracted.
We also offer excel upgrades to the software purchase for easy data analysis.
We also offer excel upgrades to the software purchase for easy data analysis.
Data Tool
RWhat's included
| Service Tiers |
Starter
$20
|
Standard
$50
|
Advanced
$150
|
|---|---|---|---|
| Delivery Time | 1 day | 5 days | 30 days |
Number of Pages Mined/Scraped | 20 | 100 | |
Number of Sources Mined/Scraped | 20 | 100 | |
Number of Revisions | Unlimited | Unlimited | Unlimited |
Optional add-ons
You can add these on the next page.
Additional Page Mined/Scraped
+$10
Additional Source Mined/Scraped
+$10Frequently asked questions
About William
Math Tutor |BSc Math & Comp Sci |Algebra |Discrete Math |Applied Math
Voi, Kenya - 2:18 pm local time
SERVICES OFFERED
~Mathematics Tutoring (Pre K- Grade 8)
Curriculums that I offer : GCSE, IGCSE, CBC, 8-4-4 System
~Subjects I specialise in : Linear Algebra : Calculus, Differentiation, Geometry, Statistics, Discrete Maths, Mathematics for Science, Integration, Set Theory, Trigonometry
~Data Visualization and Data Analysis using Excel and R programming
~Learning Approaches I use : Technology driven learning by recording and uploading class sessions on Zoom, Google Meet for the students and parents for reference and by engaging the learner patiently and objective driven by identifying and strengthening their weak areas
~Creating Academic Content for learning and revision purposes
ABOUT ME
My name is William Matende and I am a Second Honours Graduate of Bachelor of Science in Mathematics and Computer Science majoring in Applied Mathematics Option and currently pursuing Certified Information System Security Expert (CISSE), a KASNEB certified Post Graduate Course. I work part time as an Office Manager for Voi Mainland Academy kindergarten and junior school for the past 5 years and also conduct after-school math tutoring lessons to students whose parents have signed their students up for the program. I have experience in Data Science, specifically in Data Visualization on Excel software and R studios using R programming. Other programming languages I have interacted with over my bachelors years include : Python, C++, HTML+CSS.
Steps for completing your project
After purchasing the project, send requirements so William can start the project.
Delivery time starts when William receives requirements from you.
William works on your project following the steps below.
Revisions may occur after the delivery date.
BUYING AND INSTALLING THE SOFTWARE
Install R and R Studio. On the console tab, type; install.packages("shiny") To install the shiny library and type; install.packages("quantmod") To install the quantmod library. Open the source code file in your RStudio application and run the app