You will get a streamlit dashboard/web app

Project details
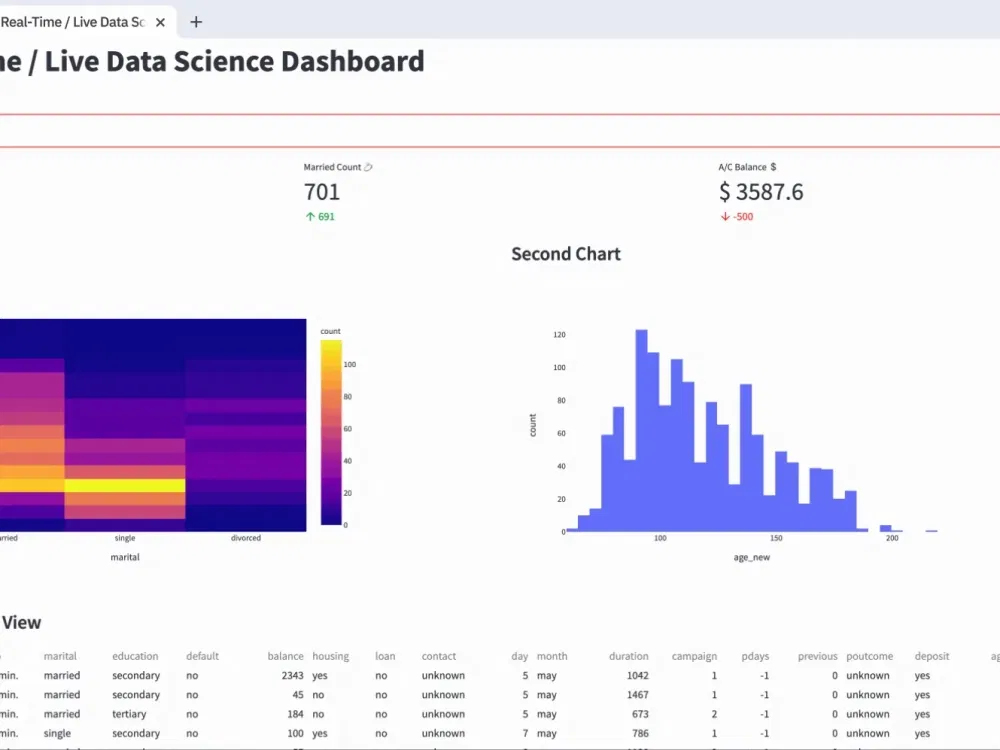
You will get a live streamlit dashboard that includes different visualizations following the best practices and real-time machine learning predictions.
My expertise includes Python, Machine Learning (including Deep Learning), Data analysis and visualization, Streamlit dashboard.
I will be/may use these tools depending on the requirements: Python, Pandas, Excel, Seaborn, Matplotlib, Plotly, Streamlit, scikit-learn (for machine learning).
I am available 24/7 and we can discuss the project details whenever it is feasible for you.
Regards,
Malik Hassan
Data Tool
PythonWhat's included
| Service Tiers |
Starter
$79
|
Standard
$199
|
Advanced
$299
|
|---|---|---|---|
| Delivery Time | 2 days | 4 days | 6 days |
Number of Revisions | 3 | 6 | Unlimited |
Source Code | - | - |
Optional add-ons
You can add these on the next page.
Fast Delivery
+$39 - $79
46 reviews
(45)
(1)
(0)
(0)
(0)
JF
Joseph F.
Nov 14, 2023
AG
Andrew G.
Oct 10, 2024
MSFT PowerBI Copilot Study - September 2024
AM
Amit M.
Apr 16, 2024
Healthcare data science research project
JF
Joseph F.
Nov 14, 2023
You will get a streamlit dashboard/web app
RT
Randall T.
Sep 8, 2023
Python Project Help
RH
Robbyn H.
Aug 6, 2023
Teachable.com Expert needed
About Malik Hassan
Data Scientist | Excel Expert
100%
Job Success
Islamabad, Pakistan - 5:47 pm local time
Areas of expertise:
- Scientific Research (research paper, review paper, meta analysis)
- Machine Learning Predictions and Classification
- Business Analysis: Business Analysis using KPIs.
- Data Analysis: Sales databases in Excel, Power BI.
- Data Modeling: Pivot & Power Pivot Tables & Charts, Interactive Plots
- Data Visualization. Creating interactive dashboards, and charts using Power BI and Plotly.
- Statistical analysis and forecasting.
Steps for completing your project
After purchasing the project, send requirements so Malik Hassan can start the project.
Delivery time starts when Malik Hassan receives requirements from you.
Malik Hassan works on your project following the steps below.
Revisions may occur after the delivery date.
Project Discussion
The most important part of a project is to understand the requirements and formulate a roadmap to achieve the end goal.
Frequent Updates
After the requirements are finalized, I will provide you with frequent updates so that you can follow up on the progress.