You will get an automated Excel Business Intelligence Dashboard
Project details
Stop drowning in messy, unformatted spreadsheet rows. Turn your raw data logs into an automated, interactive, executive-ready dashboard.
I am an experienced data developer. I build clean business intelligence applications right inside Microsoft Excel using robust backend modeling engines. Whether you need to track dynamic sales revenue, pinpoint top product performance, or deliver visually flawless data to corporate stakeholders, I engineer your file to feel like custom software.
What I deliver across my structural project tiers:
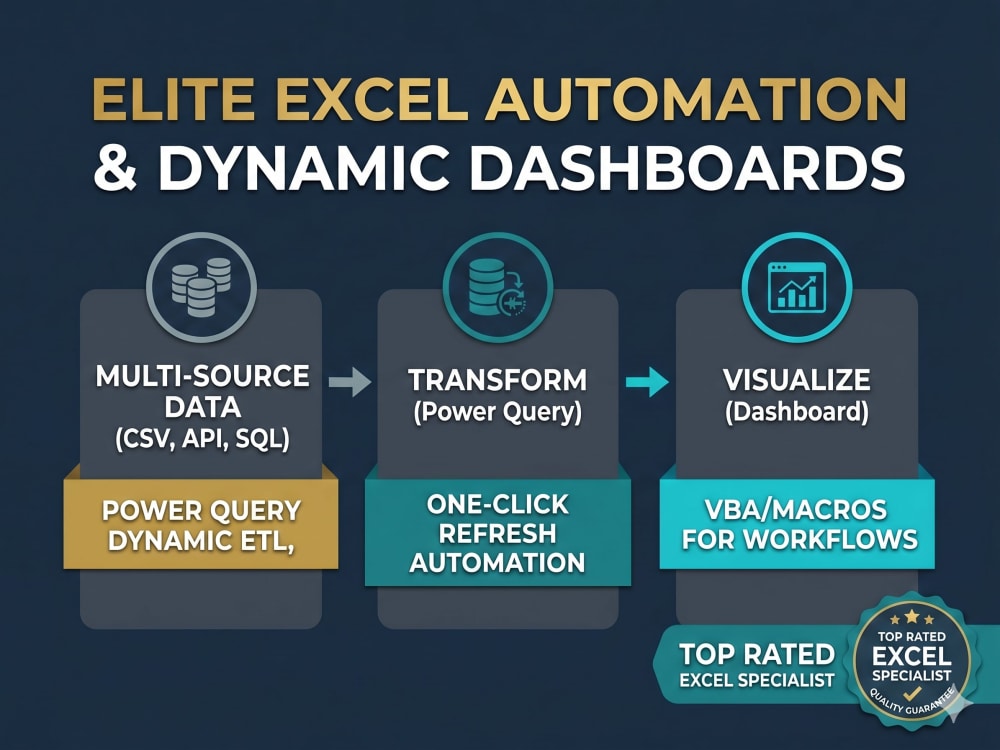
Advanced Data Engineering Backend:
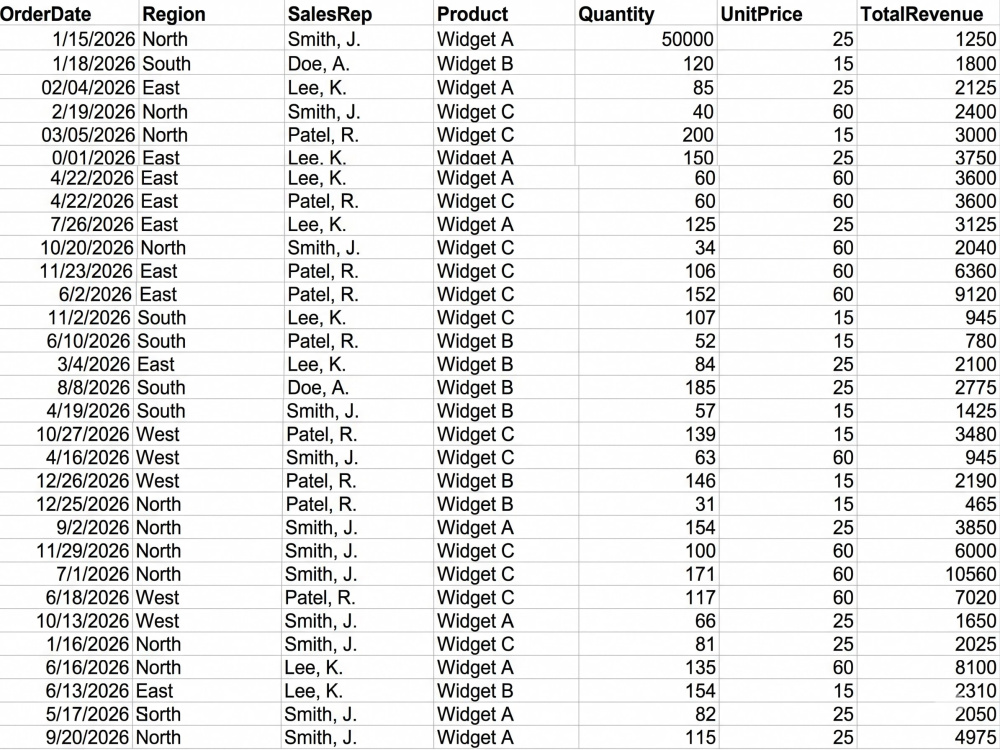
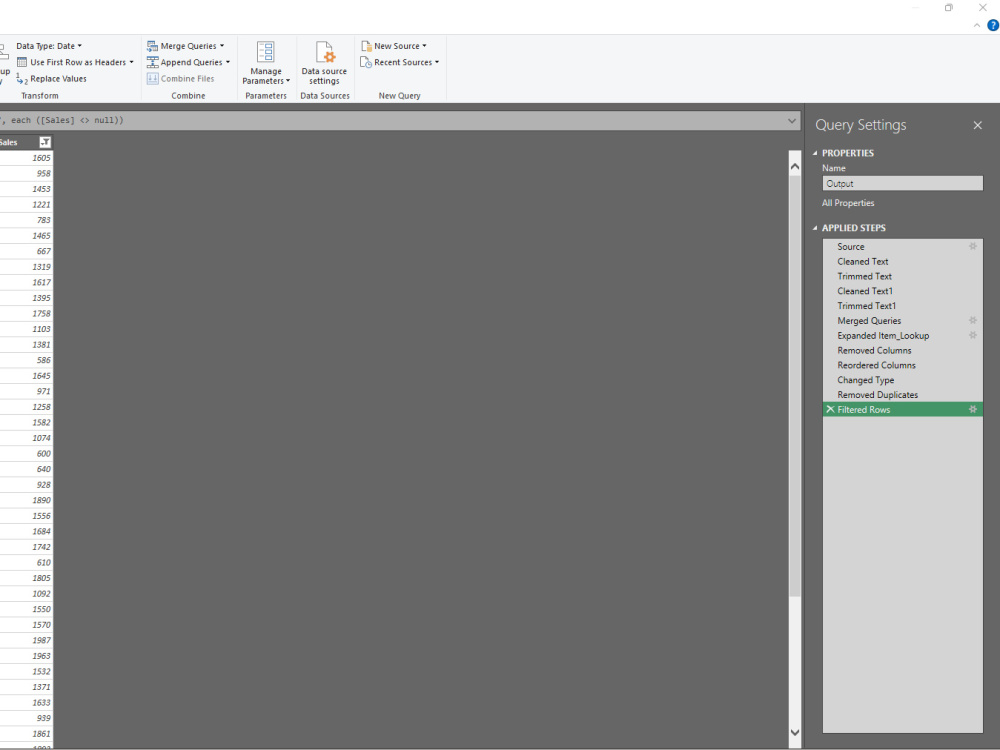
I connect your chaotic CSV or spreadsheet logs to a dedicated Power Query pipeline. This engine automatically cleans text errors, transforms data formats, and merges tables natively.
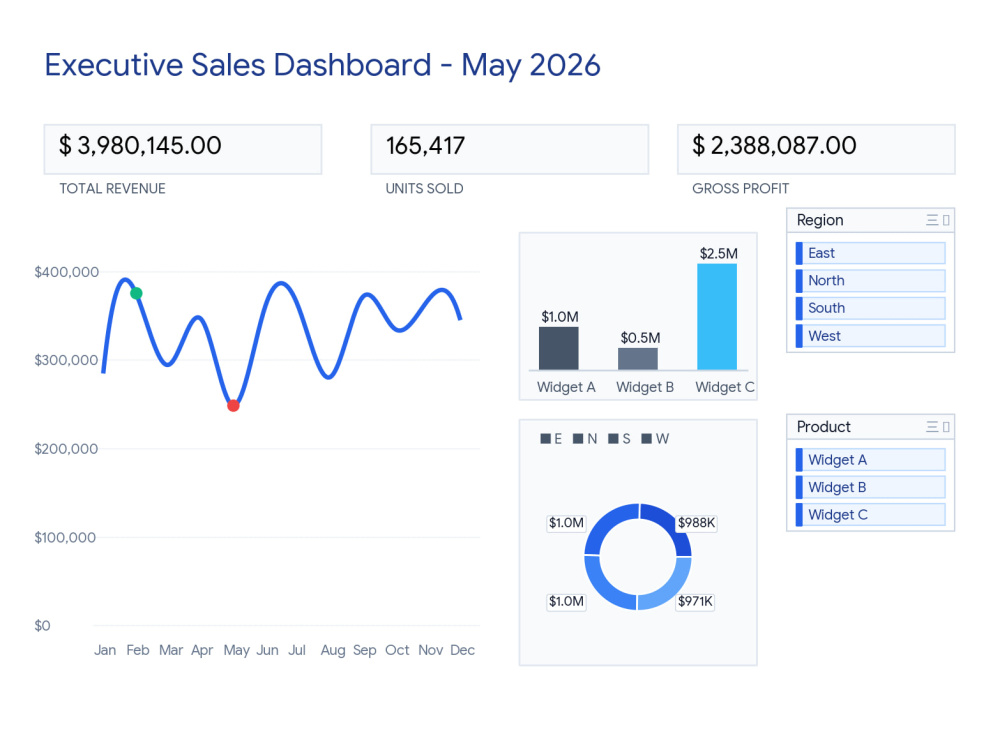
High-End Front-End Visual Interfaces:
I build modern, non-fatiguing dashboard interfaces equipped with bold executive summary blocks, synchronized slicer menus, and peak-highlighted trend charts.
Complete Macro Automation:
I embed hidden VBA utility scripts that listen to your file behavior. Your entire system automatically runs a background refresh connection the exact second you open the file.
I am an experienced data developer. I build clean business intelligence applications right inside Microsoft Excel using robust backend modeling engines. Whether you need to track dynamic sales revenue, pinpoint top product performance, or deliver visually flawless data to corporate stakeholders, I engineer your file to feel like custom software.
What I deliver across my structural project tiers:
Advanced Data Engineering Backend:
I connect your chaotic CSV or spreadsheet logs to a dedicated Power Query pipeline. This engine automatically cleans text errors, transforms data formats, and merges tables natively.
High-End Front-End Visual Interfaces:
I build modern, non-fatiguing dashboard interfaces equipped with bold executive summary blocks, synchronized slicer menus, and peak-highlighted trend charts.
Complete Macro Automation:
I embed hidden VBA utility scripts that listen to your file behavior. Your entire system automatically runs a background refresh connection the exact second you open the file.
Data Tool
Microsoft ExcelWhat's included
| Service Tiers |
Starter
$75
|
Standard
$150
|
Advanced
$250
|
|---|---|---|---|
| Delivery Time | 3 days | 5 days | 7 days |
Number of Revisions | 2 | 3 | 7 |
Number of Graphs/Charts | 1 | 3 | 3 |
Number of Variations | 2 | 3 | 7 |
Data Source Connectivity | |||
Web Embedding | - | - | - |
Interactive/Animated Visuals | - |
Optional add-ons
You can add these on the next page.
Fast Delivery
+$40 - $75
Additional Variation
(+ 1 Day)
+$20
Additional Data Source Integration
(+ 1 Day)
+$30
Custom Branding Alignment
+$40Frequently asked questions
About T. M. Jubaer
Excel Expert | Power Query & Dynamic Dashboards
Dhaka, Bangladesh - 1:14 pm local time
I bring deep, technical expertise in advanced Excel formulas, Power Query, Power Pivot, and VBA automation. My focus is always on delivering practical, implementation-ready solutions that eliminate manual tasks and save you valuable time.
Beyond backend functionality, I specialize in exceptional dashboard design. I deliver polished, professional interfaces featuring dynamic titles, perfectly aligned slicers, and pristine, user-friendly formatting. Your data won't just be meticulously accurate—it will be visually compelling and intuitive to navigate.
Backed by a structured, continuous-learning approach to data problem-solving, I ensure every tool I build is optimized for long-term efficiency. Detail-oriented and highly reliable, I am committed to partnering with you to automate tedious processes so you can make decisions with absolute confidence.
Let’s connect and turn your complex spreadsheet challenges into automated masterpieces.
Steps for completing your project
After purchasing the project, send requirements so T. M. Jubaer can start the project.
Delivery time starts when T. M. Jubaer receives requirements from you.
T. M. Jubaer works on your project following the steps below.
Revisions may occur after the delivery date.
Step 1: Initial Data Audit & Schema Mapping
Review raw data files, verify data types, check for formatting errors, and confirm final business metrics with the client
Step 2: Power Query Data pipeline Engineering
Ingest files into Power Query. Build the automated data transformation pipeline to clean text, merge tables, and optimize the cache.