You will get an end-to-end Power BI Dashboard
Top Rated
Top Rated
Project details
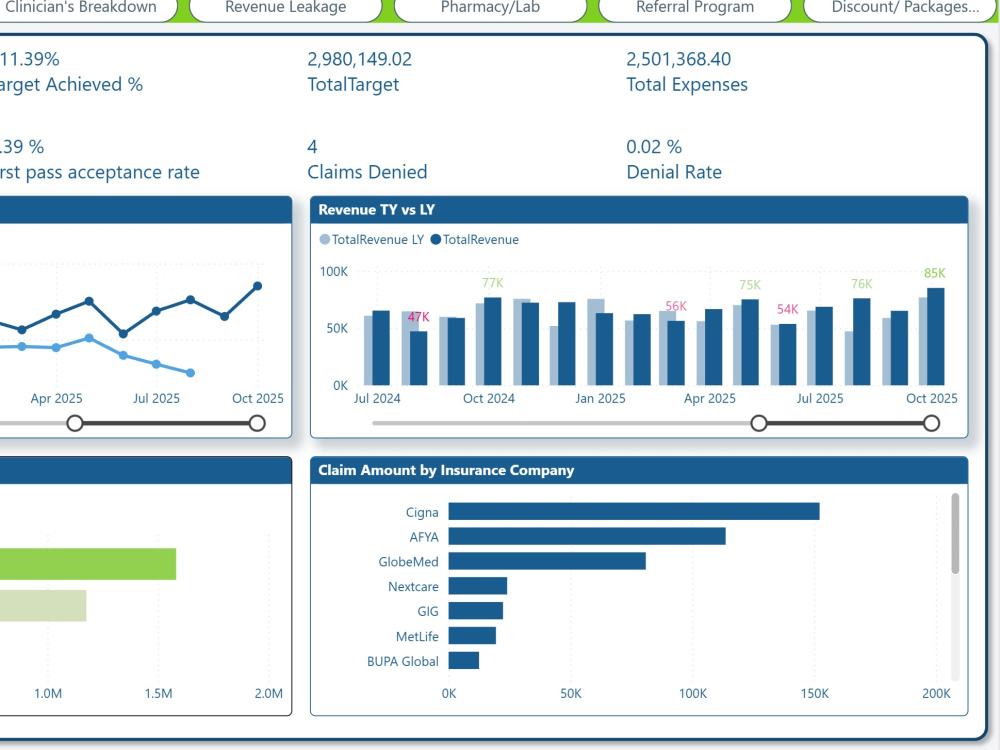
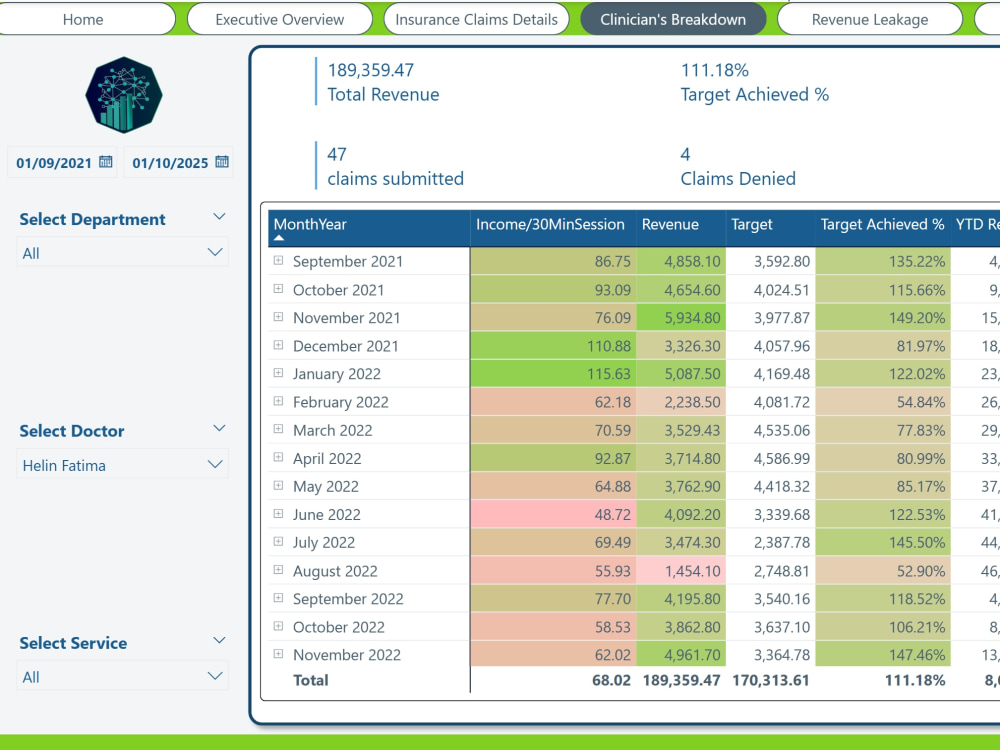
You will get a Power BI report. Our project distinguishes itself through the creation of a dynamic Power BI dashboard that seamlessly integrates and visualizes complex data sets. Leveraging advanced analytics and interactive visualizations, our dashboard provides unparalleled insights, facilitating informed decision-making. Its user-friendly design and real-time data updates set it apart, ensuring a transformative and efficient data-driven experience for stakeholders.
Data Tool
Microsoft Power BIWhat's included
| Service Tiers |
Starter
$200
|
Standard
$500
|
Advanced
$1,500
|
|---|---|---|---|
| Delivery Time | 2 days | 4 days | 7 days |
Number of Revisions | 1 | 3 | 7 |
Number of Graphs/Charts | 5 | 10 | 15 |
Number of Variations | 0 | 0 | 0 |
Data Source Connectivity | - | - | |
Web Embedding | - | ||
Interactive/Animated Visuals | - |
Optional add-ons
You can add these on the next page.
Fast Delivery
+$50 - $300
Additional Graph/Chart
+$5
40 reviews
(36)
(4)
(0)
(0)
(0)
This project doesn't have any reviews.
AO
Aston O.
May 22, 2026
Replicate Looker Studio Dashboard
EC
Ekam C.
Apr 12, 2026
Automated Australian Macro Data Feed
AO
Aston O.
Apr 1, 2026
Looker Studio Dashboard Creation for Ad Campaigns
DR
David R.
Dec 22, 2025
Excel Data Specialist for Nonprofit Impact Metrics
Excellent Performance. She was extremely responsive, providing daily updates, asking questions regarding any items to help project completion, and executing project goals. She was also willing to perform additional job needs as they arose during project. Project quality on completion: excellent. Highly recommend.
FC
Fratello C.
Nov 20, 2025
Power BI Expert for Financial Data Analysis & Reporting
About Syeda Mazia
Microsoft Certified Power BI Data Analyst (Tableau, Looker Studio)
100%
Job Success
Islamabad, Pakistan - 7:52 am local time
I design end-to-end Business Intelligence solutions that can convert fragmented data into trusted, automated reports — built for executives, analysts, and operations teams.
With 8+ years delivering BI systems across Healthcare, Pharma, Hospitality, Marketing, F&B, Retail & E-commerce, I don't just build dashboards — I build decision-making infrastructure.
Microsoft Power BI — Executive dashboards, KPI scorecards, operational reports, drilldowns, Row-Level Security (RLS), performance-tuned semantic models
Tableau — Interactive dashboards, data visualization, ad-hoc analytics, calculated fields
Excel & Power Query — Advanced formulas (XLOOKUP, Index/Match, Pivot Tables), financial projections, budgeting models, dynamic reports, Macro automation
DAX & Data Modeling — Advanced DAX measures, star schema design, calculated columns, cash flow modeling, financial reporting
ETL & Data Engineering — SQL, Power Query transformations, Python, API integrations
Power Automate & Power Apps — Workflow automation, approvals, alerts, intake forms, operational trackers, role-based portals
Looker / Looker Studio / Data Studio — Dashboard development and data visualization
Industry Expertise: Healthcare · Pharma · Hospitality · Food & Beverage · Retail · E-commerce· Marketing · Education · Finance
I know which KPIs actually move the needle in your industry — and I build around them.
Technical Stack: Power BI · DAX · Power Query (M) · Tableau · SQL · Python · Excel · SSIS · Azure · Microsoft Fabric . Power Automate · Power Apps · Looker Studio · R Studio · SPSS · API Integration
My Process
Discover — I audit your current reports, identify what's being ignored, and find where manual work is costing your team hours each week.
Model — Build clean, scalable data models with a single source of truth
Visualize — Design professional, interactive dashboards tailored to your audience
Automate — Eliminate manual steps with scheduled refresh and workflow automation
Handover — Train your team and document everything
Available for:
→ Power BI dashboard creation & redesign
→ Tableau dashboard development
→ Monthly reporting automation
→ Ad-hoc analytics & KPI development
→ Excel dashboard & financial modeling
→ Data cleaning, transformation & ETL pipelines
→ Healthcare & Pharma data analytics
→ Marketing analytics & campaign reporting
Let’s unlock the hidden value in your data, contact me today!
Steps for completing your project
After purchasing the project, send requirements so Syeda Mazia can start the project.
Delivery time starts when Syeda Mazia receives requirements from you.
Syeda Mazia works on your project following the steps below.
Revisions may occur after the delivery date.
Review and discuss the output