You will get an engaging interactive map to showcase your data beautifully
Project details
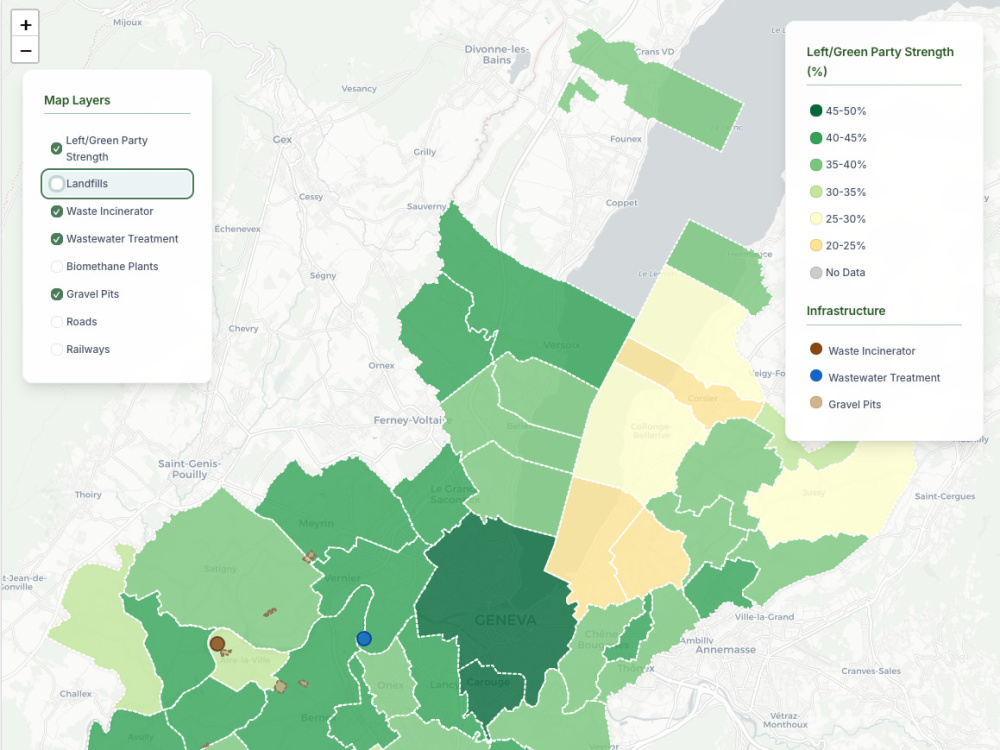
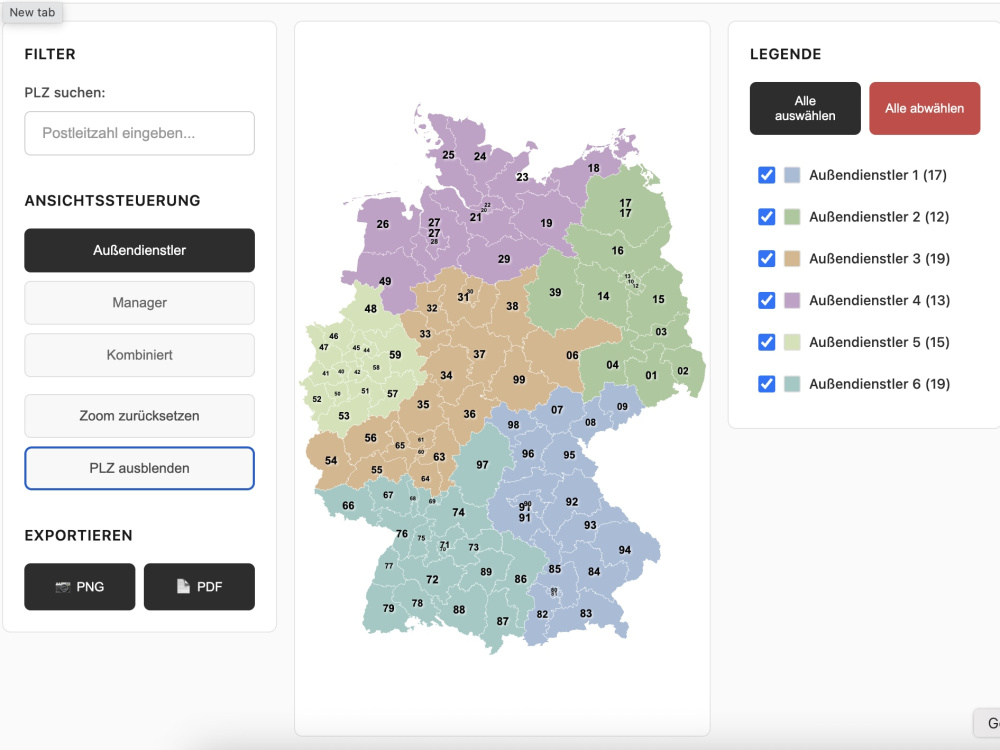
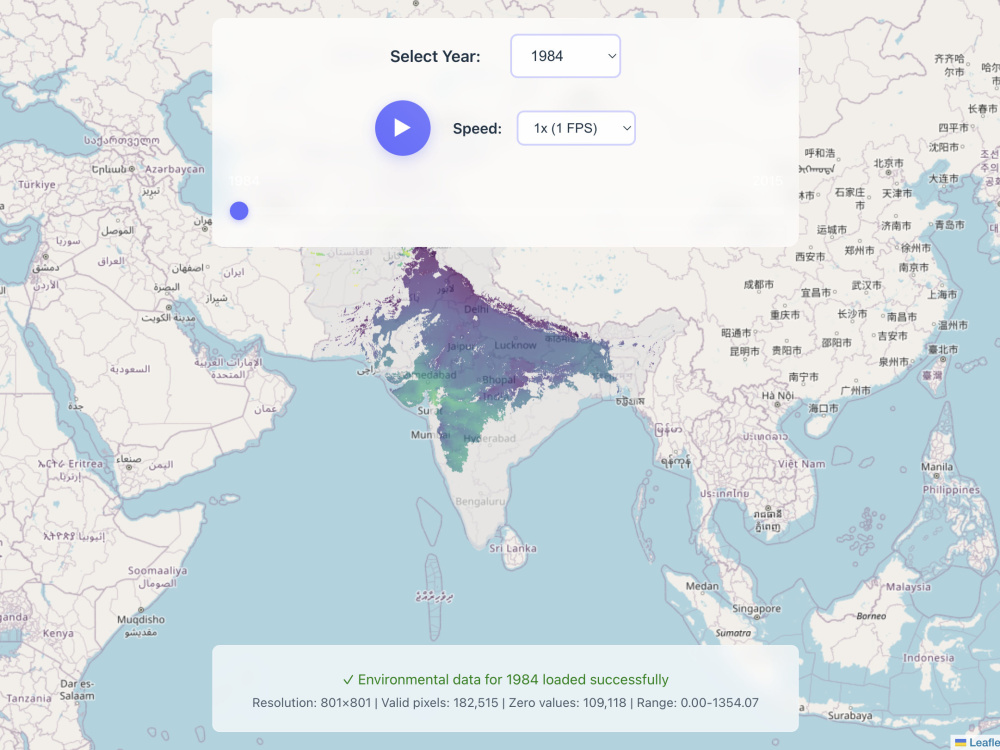
I create interactive maps that make your data easy to explore and understand. Whether you need a web-based map or a Tableau dashboard, I’ll turn your location data into a clear, engaging visualization.
You’ll get a custom interactive map with popups, filters, and clean design that works smoothly on desktop and mobile. I can use Mapbox, Leaflet, or Tableau depending on your needs.
Typical uses: data dashboards, reports, research projects, city or region overviews, or maps for websites.
I handle the setup, styling, and data prep, so you get a shareable and professional result without the tech hassle.
Send me your data and a short goal (for example: “show customer locations by region”), and I’ll build a working prototype quickly.
Let’s turn your data into something people can actually see and interact with.
Programming Languages
HTML & CSS, JavaScript, PythonCoding Expertise
Cross Browser & Device Compatibility, Performance Optimization, DesignWhat's included $150
These options are included with the project scope.
$150
- Delivery Time 3 days
- Number of Revisions 2
- Design Customization
- Content Upload
- Responsive Design
- Source Code
Optional add-ons
You can add these on the next page.
Fast 1 Day Delivery
+$50
2 reviews
(2)
(0)
(0)
(0)
(0)
This project doesn't have any reviews.
VG
Valentin G.
Aug 21, 2025
Research & Create GIS Map with Industrial, Transport, and Political Layers
Excellent on-time and on-spec delivery. Very proactive in bringing up solution approaches that are superiour to what we had in mind in the briefing.
Nk
Naga Venkata praveen k.
Aug 18, 2025
Optimize LeafletJS Heatmap Using Vector Tiles for Large Polygon Data
About Yusuf
Data Analyst, Data Map Expert
100%
Job Success
Berlin, Germany - 1:06 pm local time
What sets me apart:
Complete data journey expertise - from raw data engineering to user-friendly applications your team will actually use
Interactive mapping specialist - perfect for real estate, logistics, and location-based analysis
Business-focused approach - I deliver insights that directly impact your bottom line
Typical deliverables:
Executive dashboards for business intelligence
Interactive maps for real estate and location analysis
Automated reporting systems that save hours of manual work
Custom web applications that integrate with your existing workflows
Steps for completing your project
After purchasing the project, send requirements so Yusuf can start the project.
Delivery time starts when Yusuf receives requirements from you.
Yusuf works on your project following the steps below.
Revisions may occur after the delivery date.
Client submits requirements.
The map is created according to client requirements.