You will get an insight into the data in the form of a Graph and Charts.
Project details
Data is a new oil. And I am the refiner who understands the oil and refines it to its value.
The above sentence simply describes that when the client gives me data to derive insights from it, I just don't sit down and start visualization. I rather first understand the requirement of the client, and what the client actually wants after that if I have any doubts I ask the client. After this step, only the real visualization starts.
steps of Visualization are:
1. Understand the data OR Establish the relationship between the datasets.
2. Removing all errors OR data cleaning.
3. Use functions and formulas.
4. Plot the data into a graph.
5. Show the project to the client and if need some modification then re-correct it and again show the client for re-evaluation. This process continues until the approval of the client.
THE SATISFACTION OF THE CLIENT IS A MUST.
The above sentence simply describes that when the client gives me data to derive insights from it, I just don't sit down and start visualization. I rather first understand the requirement of the client, and what the client actually wants after that if I have any doubts I ask the client. After this step, only the real visualization starts.
steps of Visualization are:
1. Understand the data OR Establish the relationship between the datasets.
2. Removing all errors OR data cleaning.
3. Use functions and formulas.
4. Plot the data into a graph.
5. Show the project to the client and if need some modification then re-correct it and again show the client for re-evaluation. This process continues until the approval of the client.
THE SATISFACTION OF THE CLIENT IS A MUST.
Data Tool
Microsoft Power BIWhat's included
| Service Tiers |
Starter
$150
|
Standard
$250
|
Advanced
$310
|
|---|---|---|---|
| Delivery Time | 7 days | 13 days | 21 days |
Number of Revisions | 2 | 3 | 6 |
Data Source Connectivity | |||
Web Embedding | - | - | - |
Interactive/Animated Visuals |
Optional add-ons
You can add these on the next page.
Additional Revision
+$2About Devendra
Data Analyst / Business Analyst
Lucknow, India - 3:59 am local time
1. Food Environmental Atlas:- To get the insight of how the food is distributed in USA and how it effected the country and population.
2. Wine Data Analysis: To know which wine is popular, which winery is mostly preferred by the people, what is the average cost and how much does government earn from wine.
3.HR Attrition: to know how many people left the company, which department has maximum number of attrition and why they are leaving.
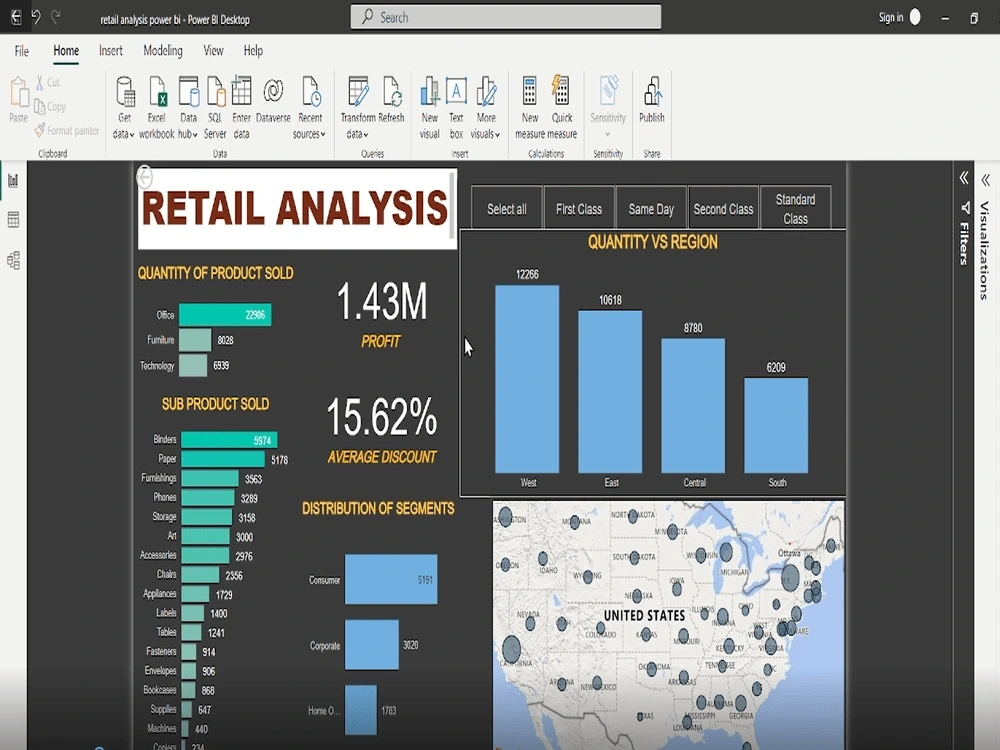
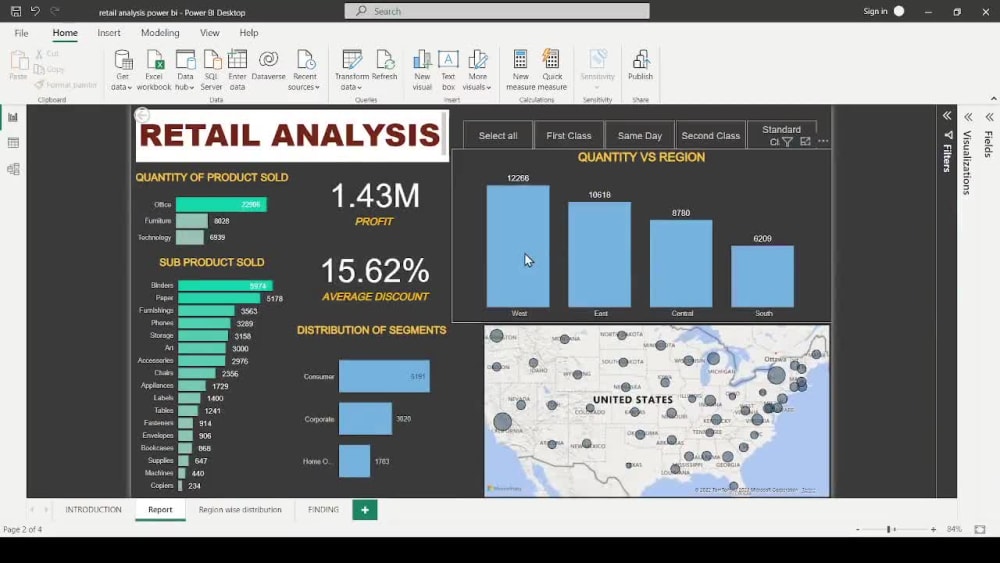
4. Retail Analysis: To get the insight which product is performing very well, why some states generating negative profit and what are the weak areas.
Power BI, Python, Numpy, Pandas, Matplotlib, Seaborn, Sql, Excel, IBM SPSS, Statistics, Dashboard, Workbench, Project Management.
What do I offer :
1. 100% Satisfaction
2. 18/7 support(6 hours sleep)
3. 15 days support after delivery
4. Unlimited Revision.
5. Stay in touch with client after delivery.
6. Put all my effort to deliver product at time.
Steps for completing your project
After purchasing the project, send requirements so Devendra can start the project.
Delivery time starts when Devendra receives requirements from you.
Devendra works on your project following the steps below.
Revisions may occur after the delivery date.
Step 1: Data Received
I will review the data and message you if I have any questions before proceeding.
Step 2: Preparation of Data Visuals
A dashboard is prepared and given to the client for review.