You will get an interactive or animated graph, plot, or map made in R
Project details
A good figure makes your research understandable and memorable. I take pride in creating intuitive graphs that effectively convey your scientific message!
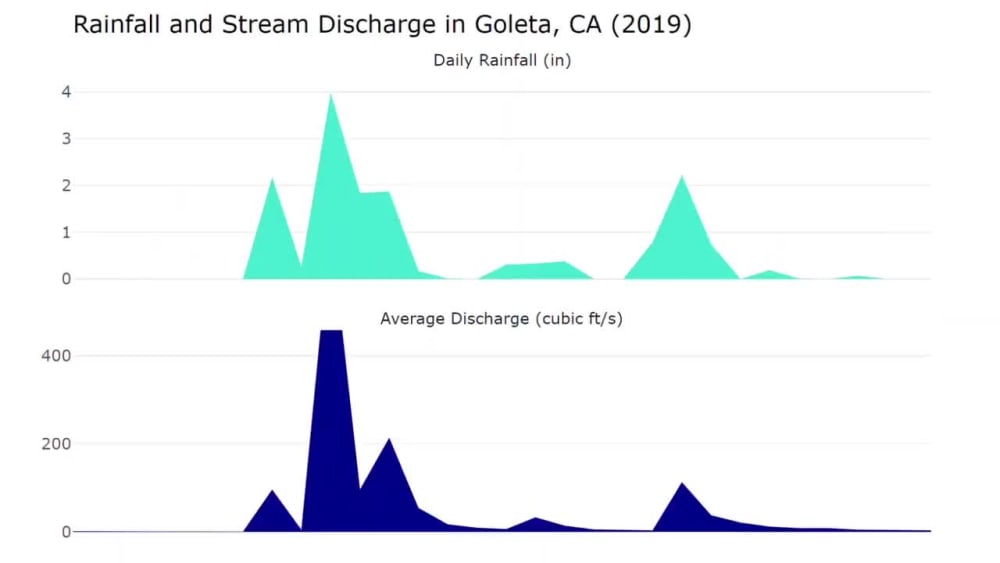
I create interactive and animated graphs, plots, charts, and maps using the statistical programming language R. Use my figures in your presentation, website, or report.
Graph details:
- Interactive or animated
- Full color
- Customizable design: Legend, axes, icons, background, etc.
- R source code included for all graphs
- Embeddable HTML (.html) or animated GIF (.gif) file
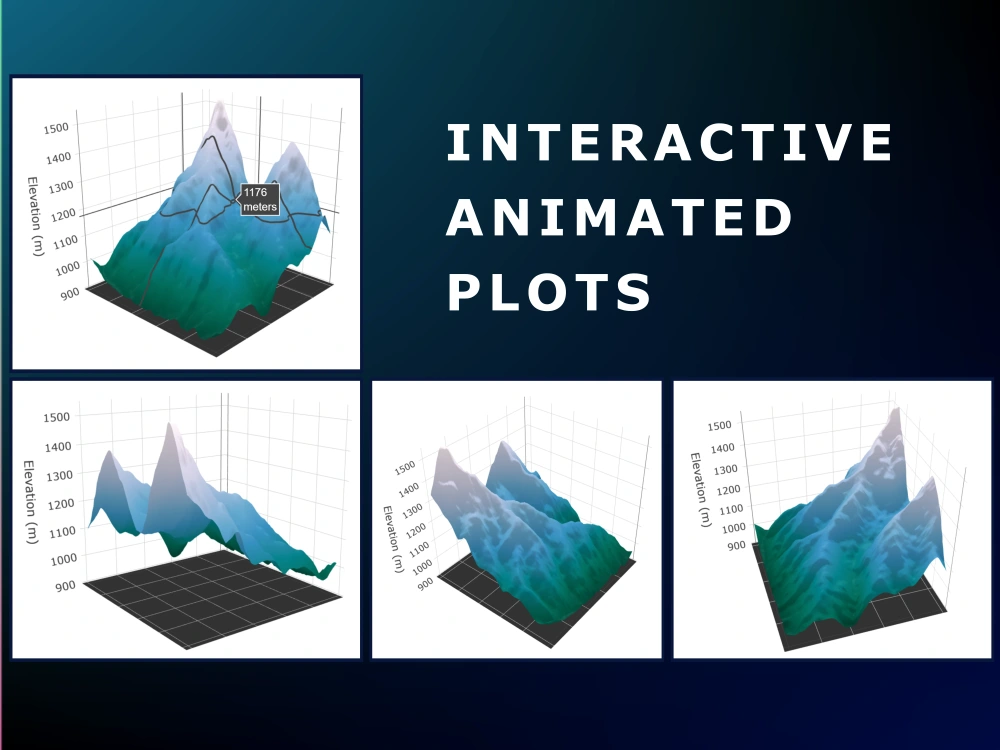
- Many graph types available: Line graph, bar chart, scatter plot, boxplot, histogram, pie chart, correlogram, chloropleth map, heat map, ridgeline plot, 3D graph, and more
Interactions and animations available:
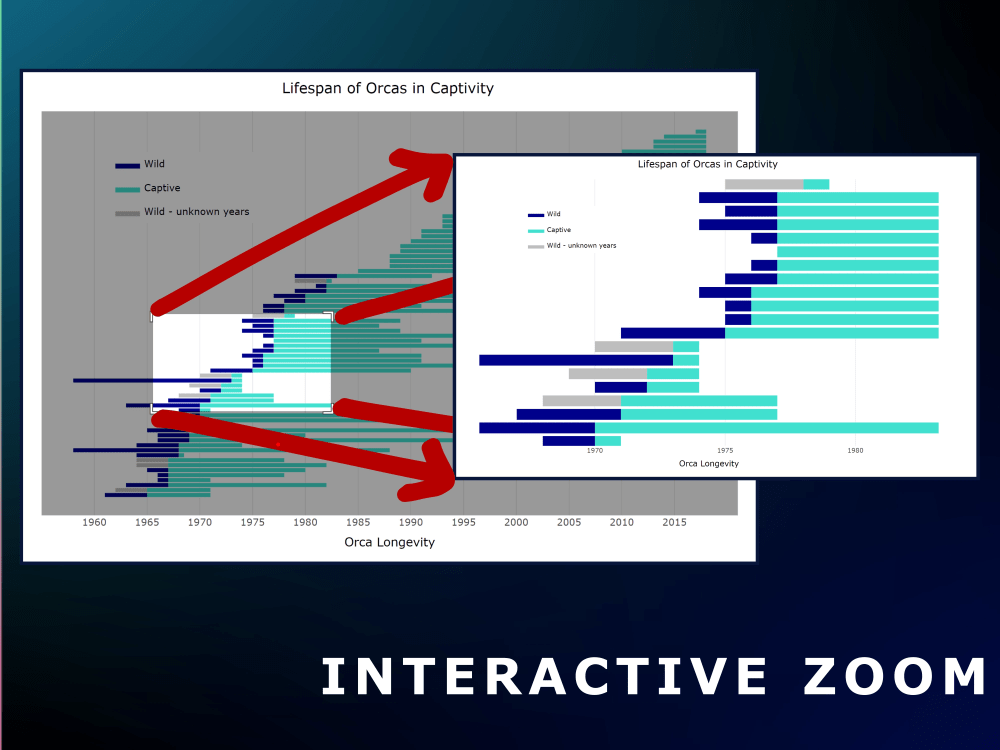
- Zoom function
- Mouse-over labels
- User data selection with sliders, buttons, or drop-down menus
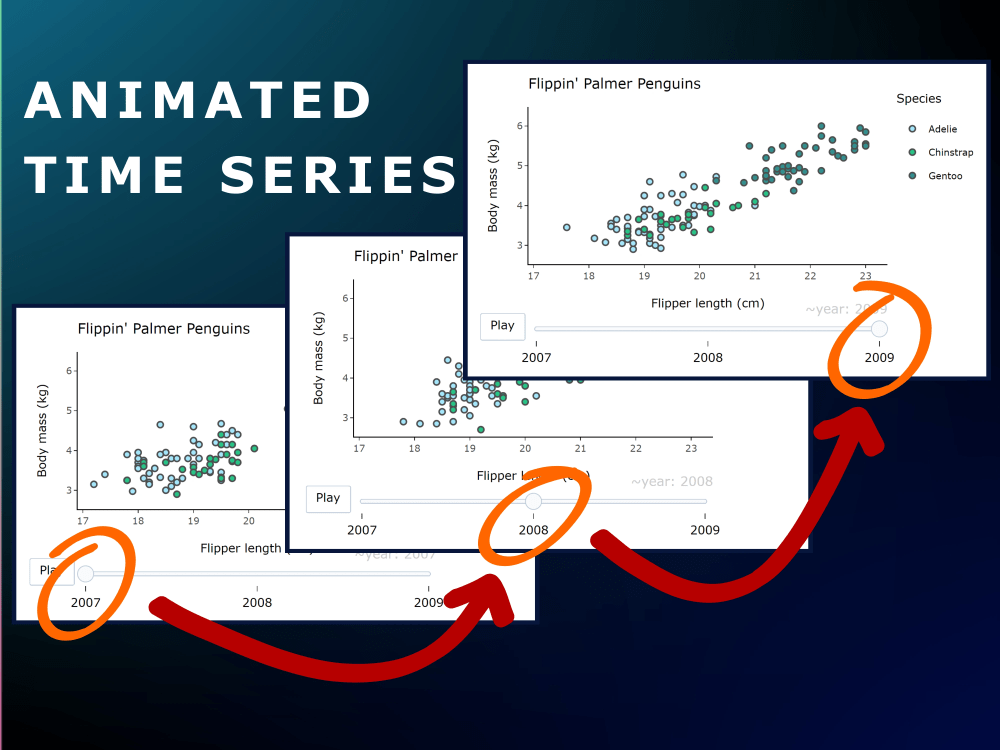
- Animated time series
- Interactive maps
- Movable 3D plots
Don't hesitate to contact me to discuss your project before placing an order! I am always open to custom projects with extra complexity, multiple plots or graphs, maps, etc.
Let's show off your science to the world in style!
I create interactive and animated graphs, plots, charts, and maps using the statistical programming language R. Use my figures in your presentation, website, or report.
Graph details:
- Interactive or animated
- Full color
- Customizable design: Legend, axes, icons, background, etc.
- R source code included for all graphs
- Embeddable HTML (.html) or animated GIF (.gif) file
- Many graph types available: Line graph, bar chart, scatter plot, boxplot, histogram, pie chart, correlogram, chloropleth map, heat map, ridgeline plot, 3D graph, and more
Interactions and animations available:
- Zoom function
- Mouse-over labels
- User data selection with sliders, buttons, or drop-down menus
- Animated time series
- Interactive maps
- Movable 3D plots
Don't hesitate to contact me to discuss your project before placing an order! I am always open to custom projects with extra complexity, multiple plots or graphs, maps, etc.
Let's show off your science to the world in style!
Data Tool
RWhat's included
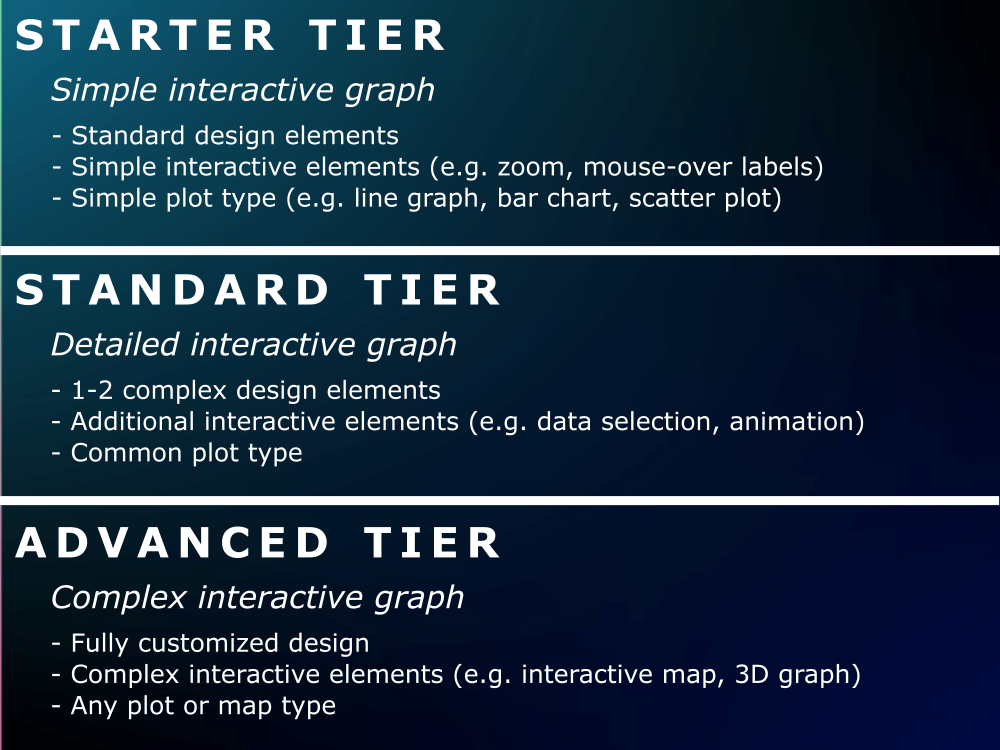
| Service Tiers |
Starter
$20
|
Standard
$35
|
Advanced
$50
|
|---|---|---|---|
| Delivery Time | 2 days | 2 days | 3 days |
Number of Revisions | 2 | 3 | Unlimited |
Data Source Connectivity | - | - | - |
Web Embedding | |||
Interactive/Animated Visuals |
Optional add-ons
You can add these on the next page.
Static Version
+$5About Kathryn
Science Communicator | Figures and Data Visualization
Goleta, United States - 1:27 pm local time
My skills and qualifications:
- 5 years of data science experience in academia
- Highly proficient at data visualization and analysis using R in RStudio
- Competent at scientific illustration using Krita (rasters) and Inkscape (vectors)
- Published figures in multiple journals including Nature Chem and Ecology and Evolution
Scientific figures can be fun and AND convey complex information! Let's work together to ensure that your readers understand, enjoy, and remember your research.
Steps for completing your project
After purchasing the project, send requirements so Kathryn can start the project.
Delivery time starts when Kathryn receives requirements from you.
Kathryn works on your project following the steps below.
Revisions may occur after the delivery date.
Create and send draft figure based on requirements sent by client
Receive feedback from client