You will get an interactive tableau dashboards and visualization for data analysis
Project details
Transform your complex data into powerful insights with custom Tableau dashboards!
As a seasoned Tableau Developer with 6+ years of experience and an MS in Computer Science, I specialize in turning raw data into intuitive, interactive visualizations that drive decision-making.
Why Choose Me:
Proven results: Improved decision-making efficiency by up to 40%
Retail analysis expert: Forecasting, customer targeting, new customer acquisition
Technical skills: SQL for data prep, Python for advanced analytics
Affordable: Starting from just $10
Satisfaction guaranteed: Unlimited revisions
Services:
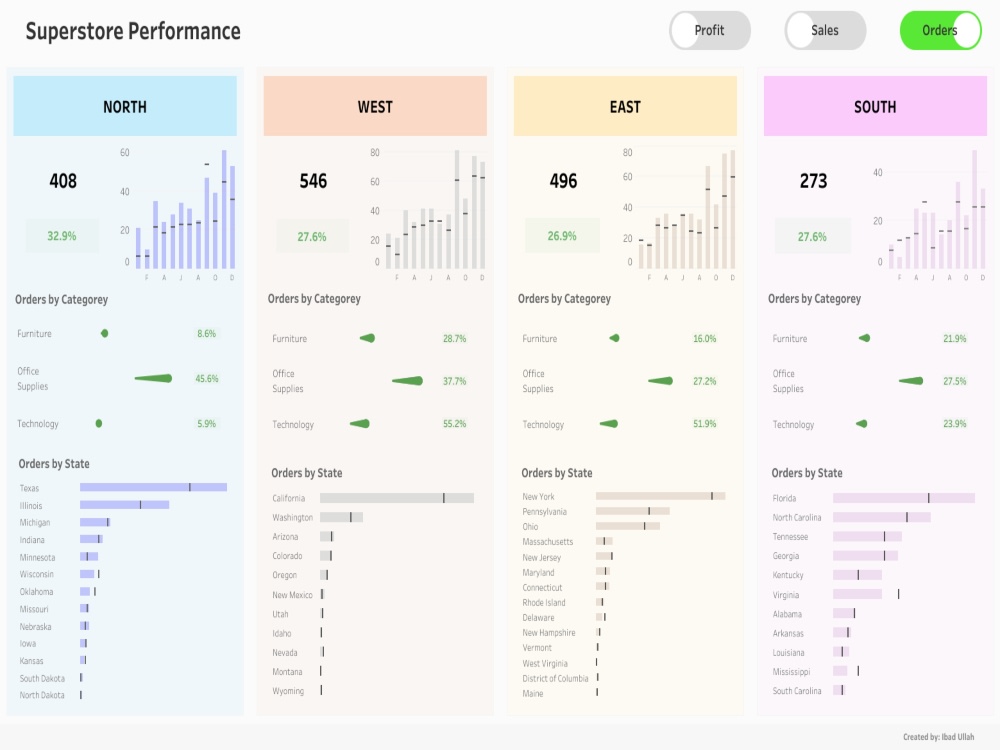
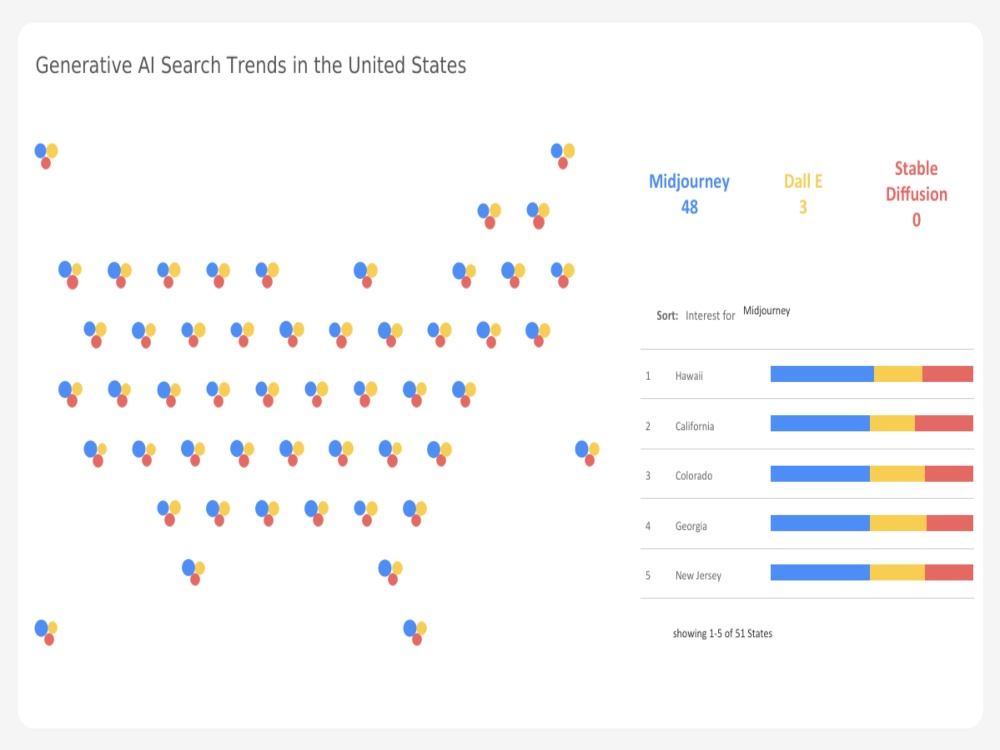
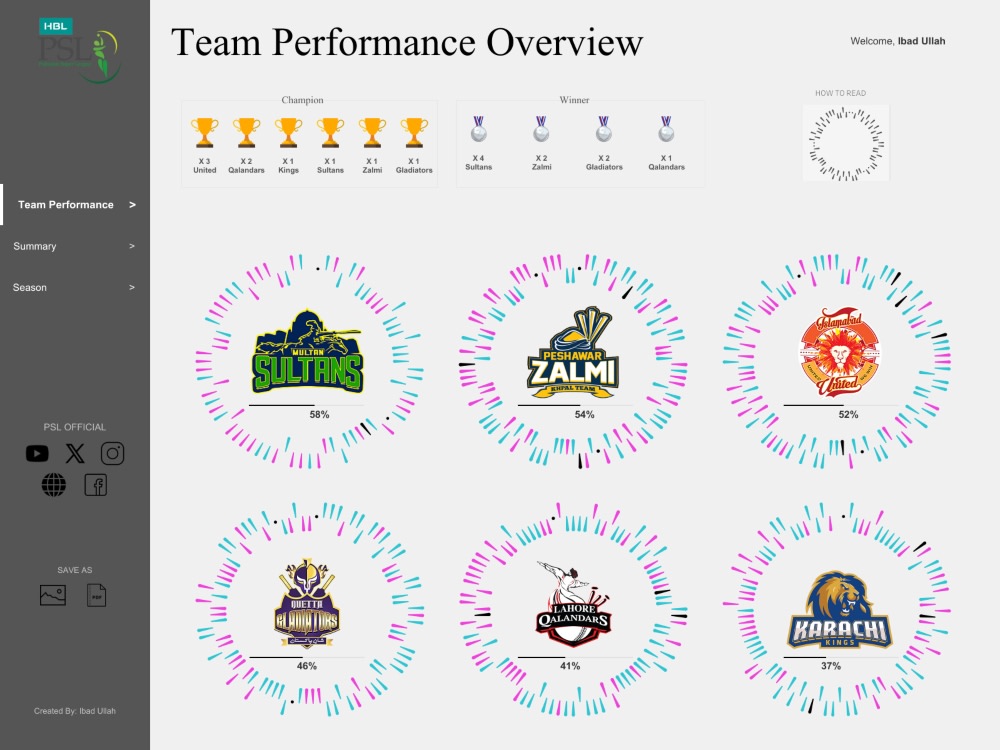
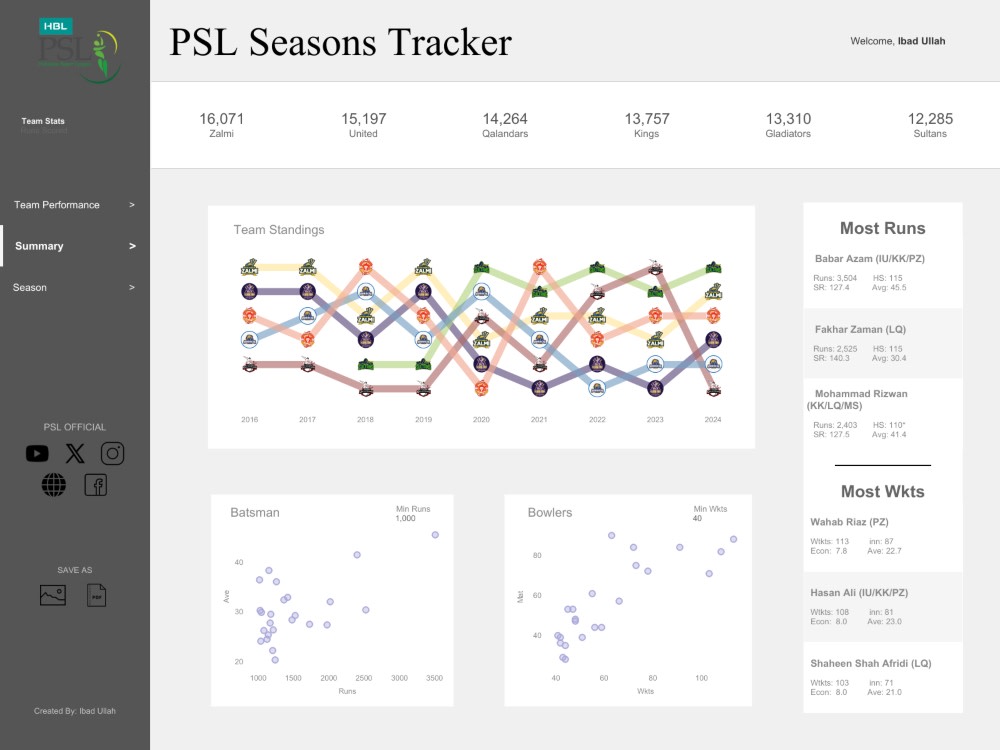
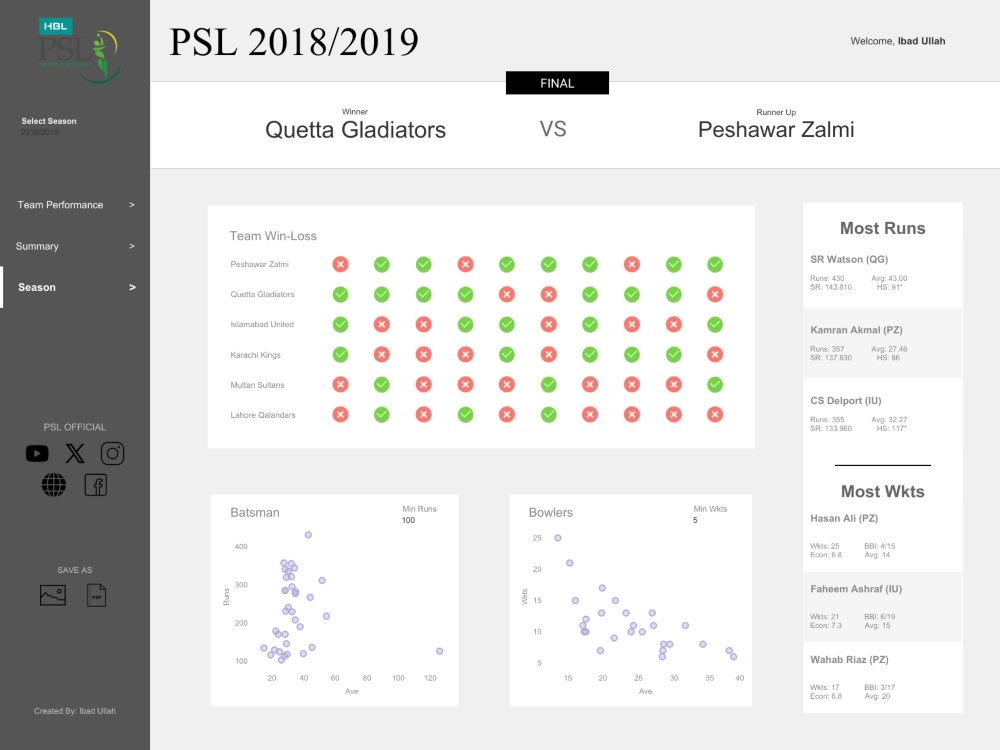
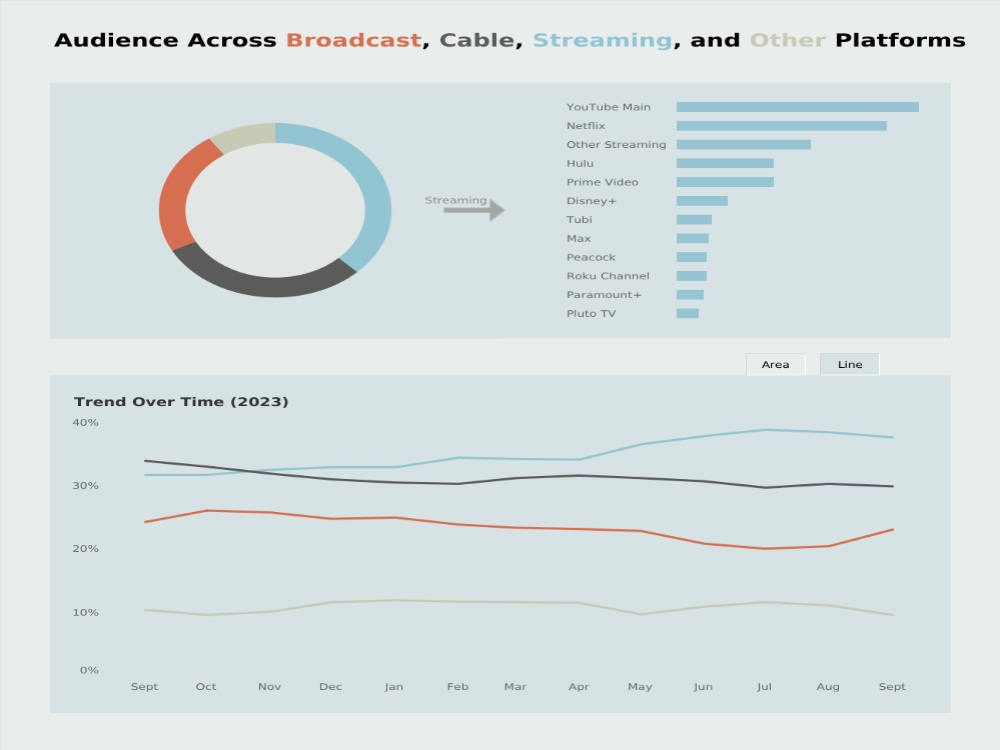
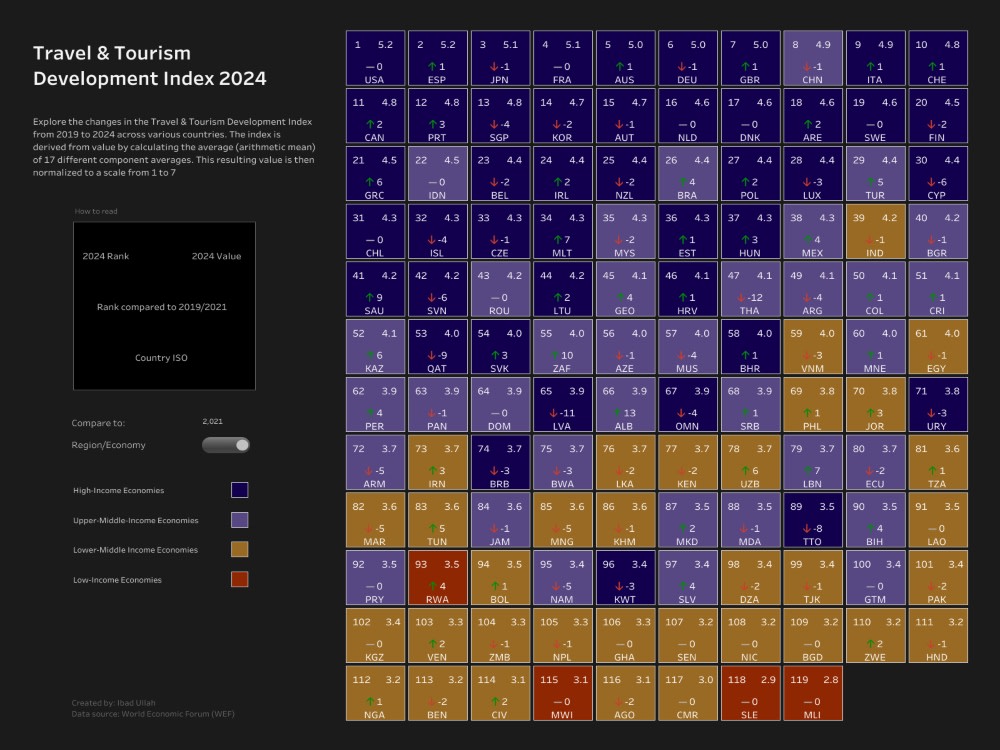
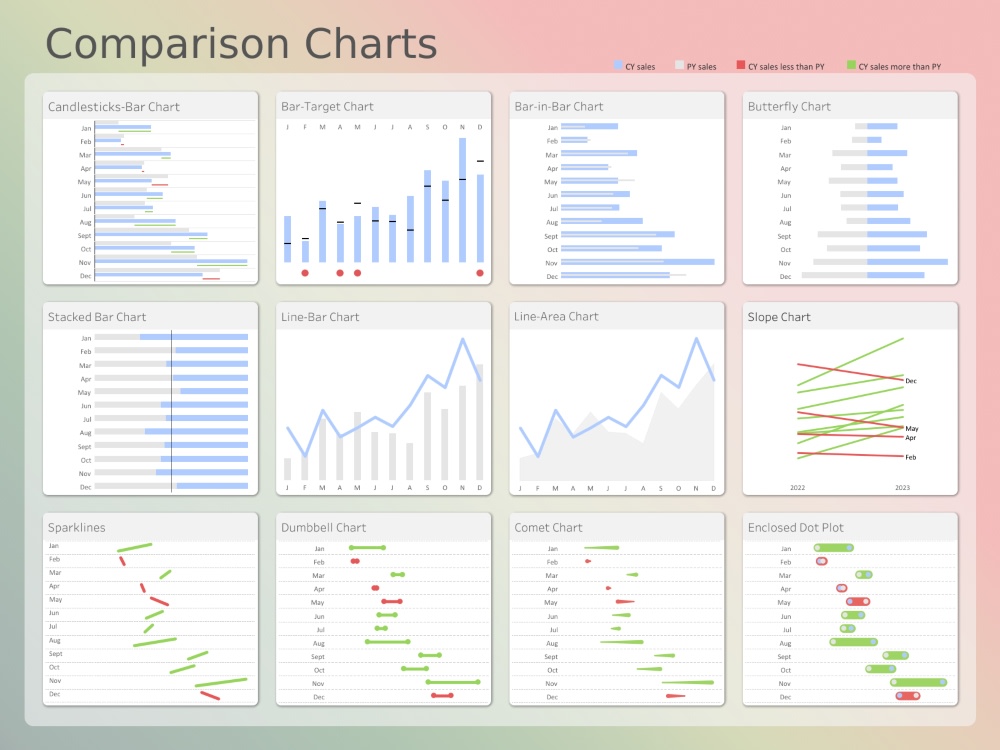
Custom charts: Bar, Donut, Line, Pie, Area, Scatter plot, Bubble timeline, Treemap, Heatmap, Sparklines, Steam graph, Butterfly, Plan actual variance, Bump
Interactive dashboards and reports
Advanced Tableau features: Table Calculations, Dual axis charts, Calculated Fields, Parameters, Drill-down functionality
Dashboard customization and optimization
Dynamic zone visibility
Action integration (filters, highlighting, sets)
Process:
Share your data and goals
Receive custom dashboard within 1-2 days
Review and request revisions until satisfied
Please message me to discuss your project
As a seasoned Tableau Developer with 6+ years of experience and an MS in Computer Science, I specialize in turning raw data into intuitive, interactive visualizations that drive decision-making.
Why Choose Me:
Proven results: Improved decision-making efficiency by up to 40%
Retail analysis expert: Forecasting, customer targeting, new customer acquisition
Technical skills: SQL for data prep, Python for advanced analytics
Affordable: Starting from just $10
Satisfaction guaranteed: Unlimited revisions
Services:
Custom charts: Bar, Donut, Line, Pie, Area, Scatter plot, Bubble timeline, Treemap, Heatmap, Sparklines, Steam graph, Butterfly, Plan actual variance, Bump
Interactive dashboards and reports
Advanced Tableau features: Table Calculations, Dual axis charts, Calculated Fields, Parameters, Drill-down functionality
Dashboard customization and optimization
Dynamic zone visibility
Action integration (filters, highlighting, sets)
Process:
Share your data and goals
Receive custom dashboard within 1-2 days
Review and request revisions until satisfied
Please message me to discuss your project
Data Tool
TableauWhat's included
| Service Tiers |
Starter
$20
|
Standard
$40
|
Advanced
$80
|
|---|---|---|---|
| Delivery Time | 1 day | 2 days | 3 days |
Number of Revisions | 3 | 3 | 3 |
Number of Graphs/Charts | 3 | 4 | 4 |
Number of Variations | 3 | 4 | 4 |
Data Source Connectivity | |||
Web Embedding | |||
Interactive/Animated Visuals |
Frequently asked questions
About Ibad
Data Analyst | SQL | Tableau | Power BI | Python
Peshawar, Pakistan - 12:10 am local time
🔍 What I Can Do for You:
Build and automate interactive dashboards (Tableau / Power BI)
Perform advanced SQL analysis and write optimized queries
Conduct customer segmentation using RFM modeling
Analyze user behavior and KPIs like CLTV, churn, and retention
Clean, transform, and visualize data for decision-making
Run A/B testing for products and marketing campaigns
Deliver end-to-end data pipelines (ETL processes)
💡 Key Tools & Skills:
SQL (MySQL, PostgreSQL, BigQuery)
Python (Pandas, NumPy, Matplotlib, Seaborn)
Tableau | Power BI | Excel | Google Sheets
Data wrangling, mining, and visualization
Git | GitHub | Data Modeling | KPI Reporting
🌐 Github: github.com/IbadDE
🌐 Tableau: public.tableau.com/app/profile/ibad.ullah7549/vizzes
Steps for completing your project
After purchasing the project, send requirements so Ibad can start the project.
Delivery time starts when Ibad receives requirements from you.
Ibad works on your project following the steps below.
Revisions may occur after the delivery date.
Initial Consultation and Requirements Gathering
Discuss client's data, goals, and specific visualization needs
Data Review and Preparation
Analyze provided data