You will get an Interactive Tableau Dashboards with detailed Insights and Analytics


Project details
I am working as a Senior Tableau Developer and Reporting Analyst with Tata Consultancy Services. I have an experience of 5+ years in Dashboard Designing and Data Visualization. I have an experience of end to end development of a dashboard right from requirement gathering, preparing report requirement documents and developing a dashboard, testing the dashboard and deploying it on the server for production. Apart from Tableau I also have experience with Google Data Studio and Power BI.
I have developed dashboards for many reputed clients like Google, Akamai, Generali Vitality, and Zimmer Biomet.
My Expertise includes:
Tableau Desktop
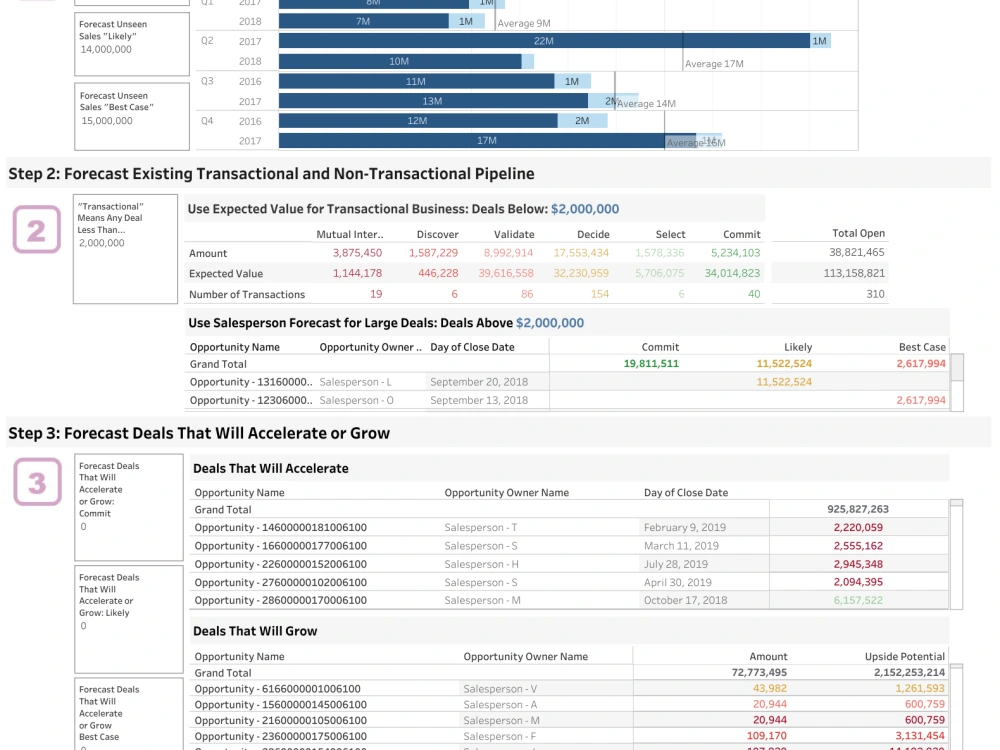
Creating complex dashboards using parameters, sets, groups, calculations, drill up and drill down and customization using actions and filters and LODs.
Writing SQL queries to fetch the data and build the dashboard on top of it.
I have developed dashboards for many reputed clients like Google, Akamai, Generali Vitality, and Zimmer Biomet.
My Expertise includes:
Tableau Desktop
Creating complex dashboards using parameters, sets, groups, calculations, drill up and drill down and customization using actions and filters and LODs.
Writing SQL queries to fetch the data and build the dashboard on top of it.
Data Tool
TableauWhat's included
| Service Tiers |
Starter
$30
|
Standard
$60
|
Advanced
$90
|
|---|---|---|---|
| Delivery Time | 1 day | 3 days | 7 days |
Number of Revisions | 9 | Unlimited | Unlimited |
Number of Graphs/Charts | 5 | 10 | 20 |
Number of Variations | 5 | 10 | 20 |
Data Source Connectivity | - | ||
Web Embedding | |||
Interactive/Animated Visuals |
Optional add-ons
You can add these on the next page.
Fast Delivery
+$15 - $40
Additional Revision
+$10
Additional Graph/Chart
+$10
Additional Variation
(+ 1 Day)
+$10
Data Source Connectivity
(+ 1 Day)
+$10
Need a Power Point Presentation to present to senior management
(+ 1 Day)
+$30About Andrean
Data Analytics, Tableau Developer, Power BI, Excel, Google Data Studio
Gurgaon, India - 9:50 am local time
● I am experienced in Tableau, Tableau Server, SQL, Power BI, Google Data Studio.
● Built Strategic, Analytical and Operational dashboards in Tableau
● Responsible for end to end tableau reporting from requirement gathering, preparing
business review documents for different geographies, development of tableau
dashboard, performing UAT and then deployment of dashboard for production..
● Created complex dashboards using parameters, sets, groups, calculations, drill up and
drill down and customization using actions and filters.
● As a tableau SME, responsible for the design, development and production support of
interactive visualization used across the company.
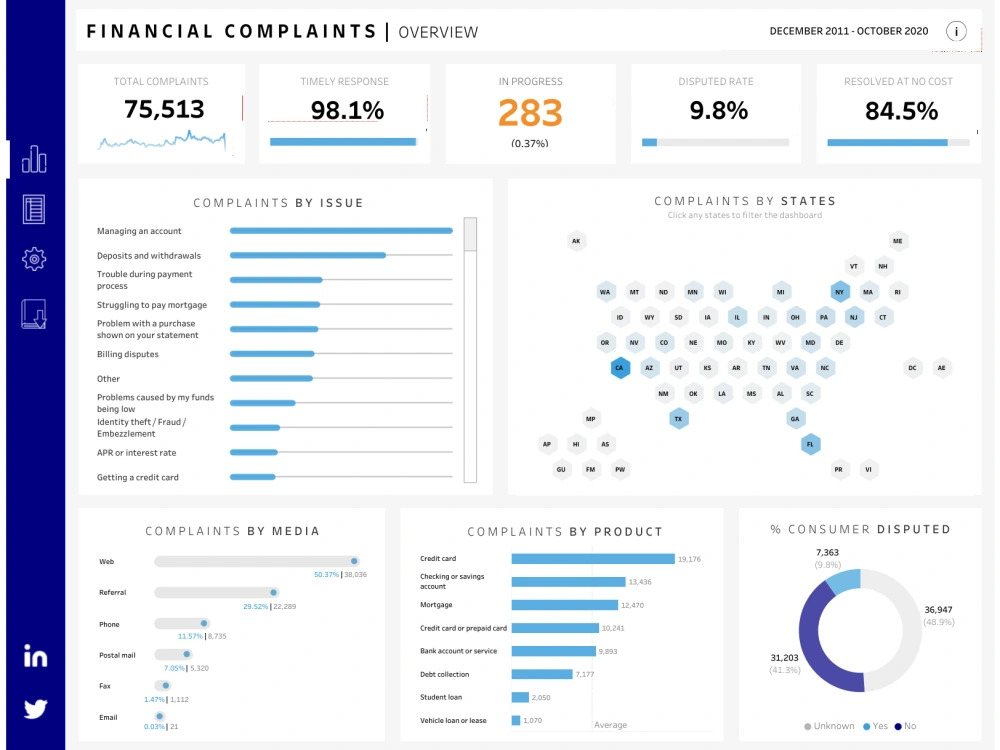
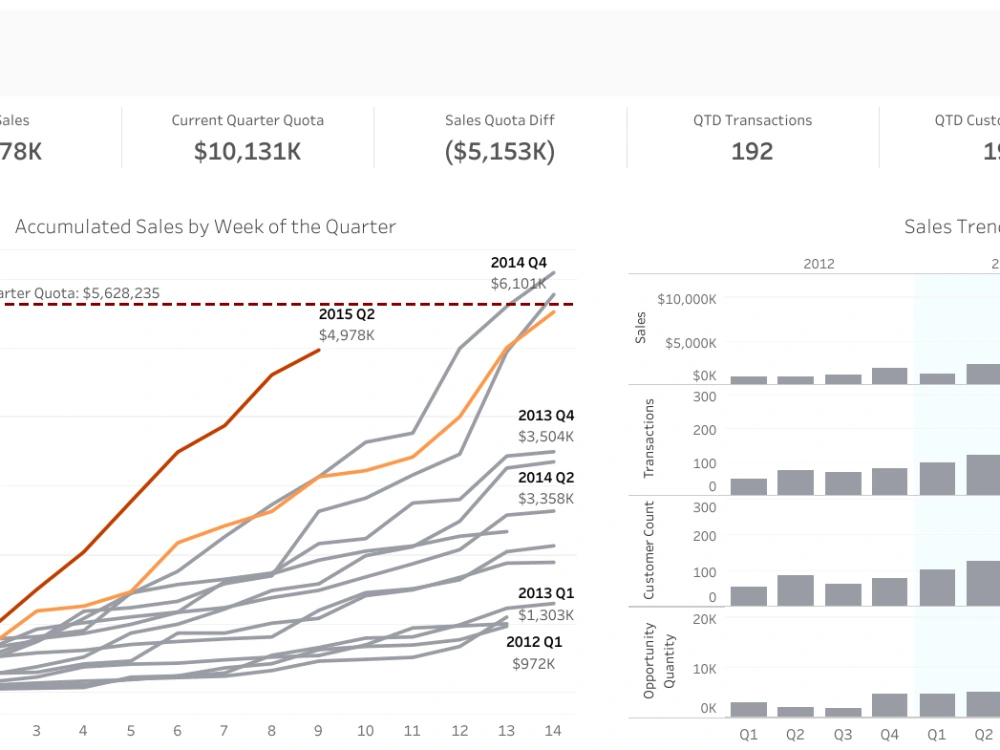
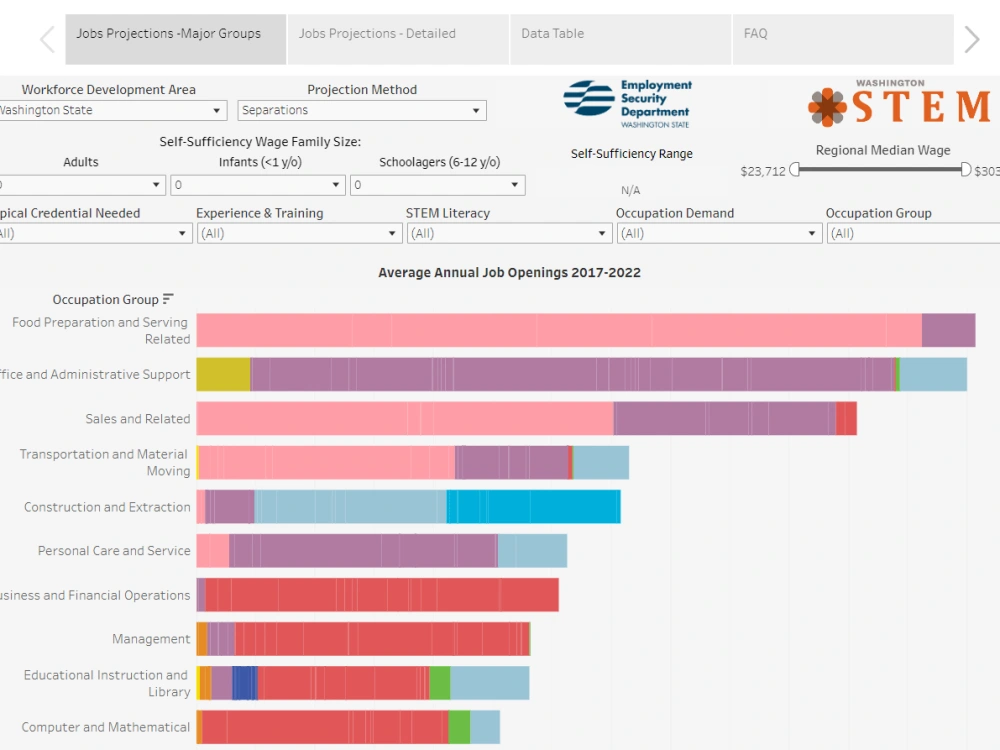
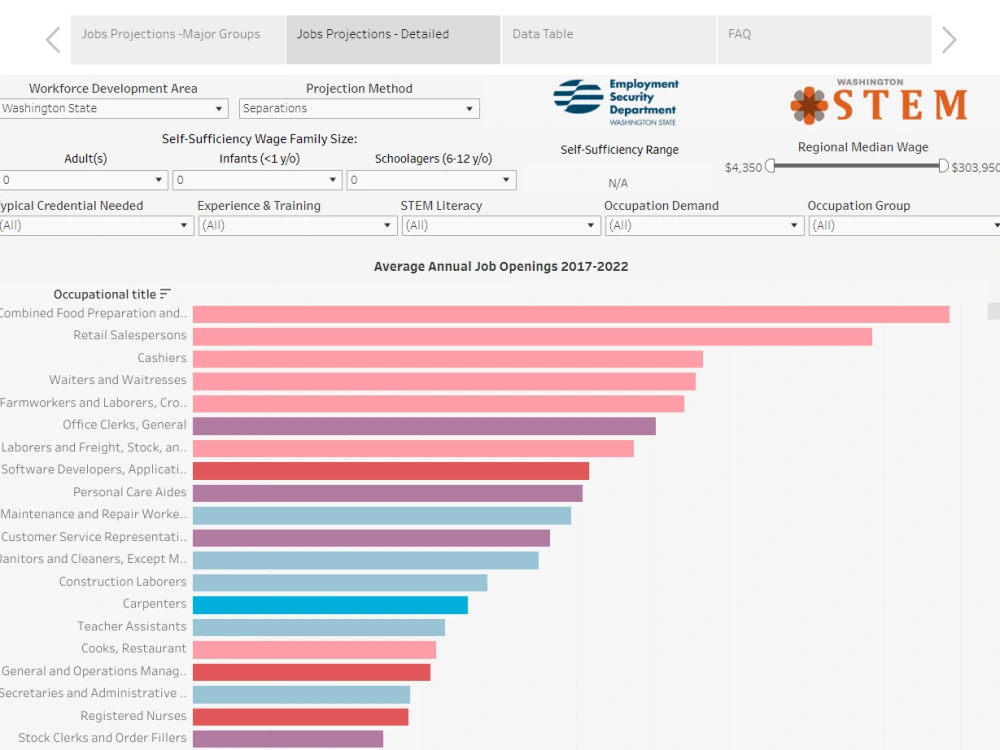
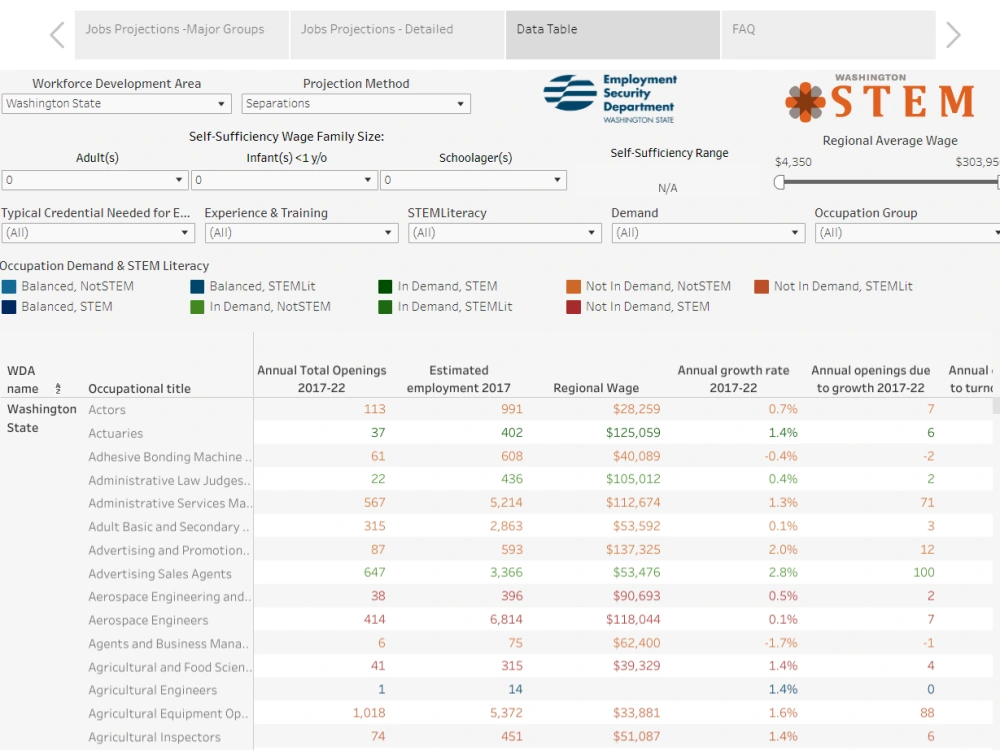
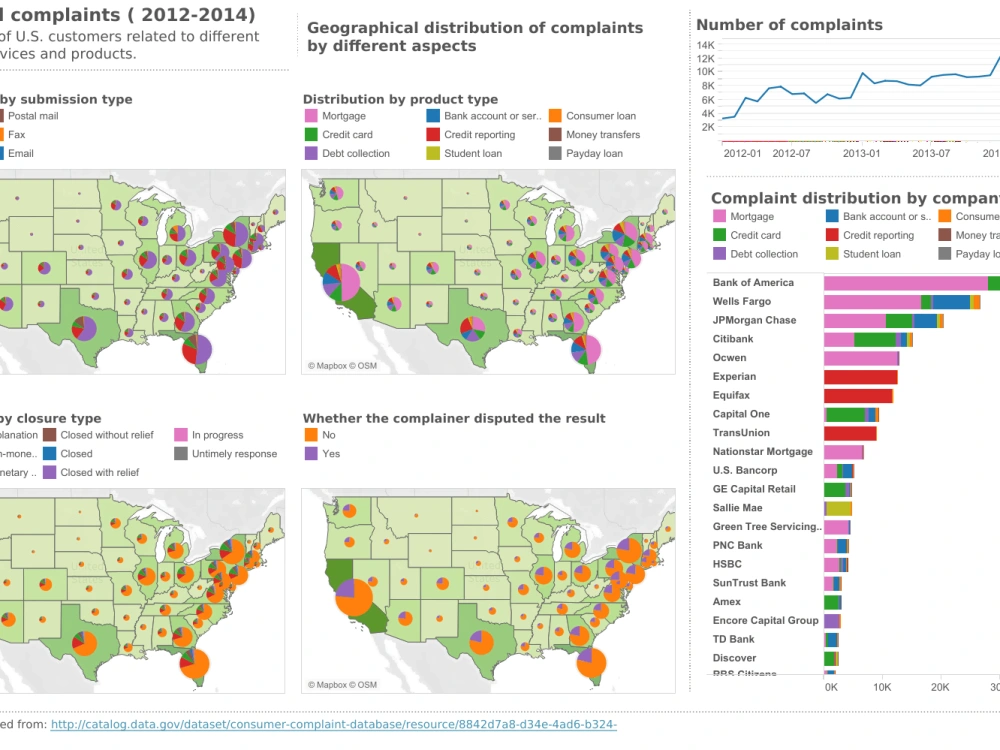
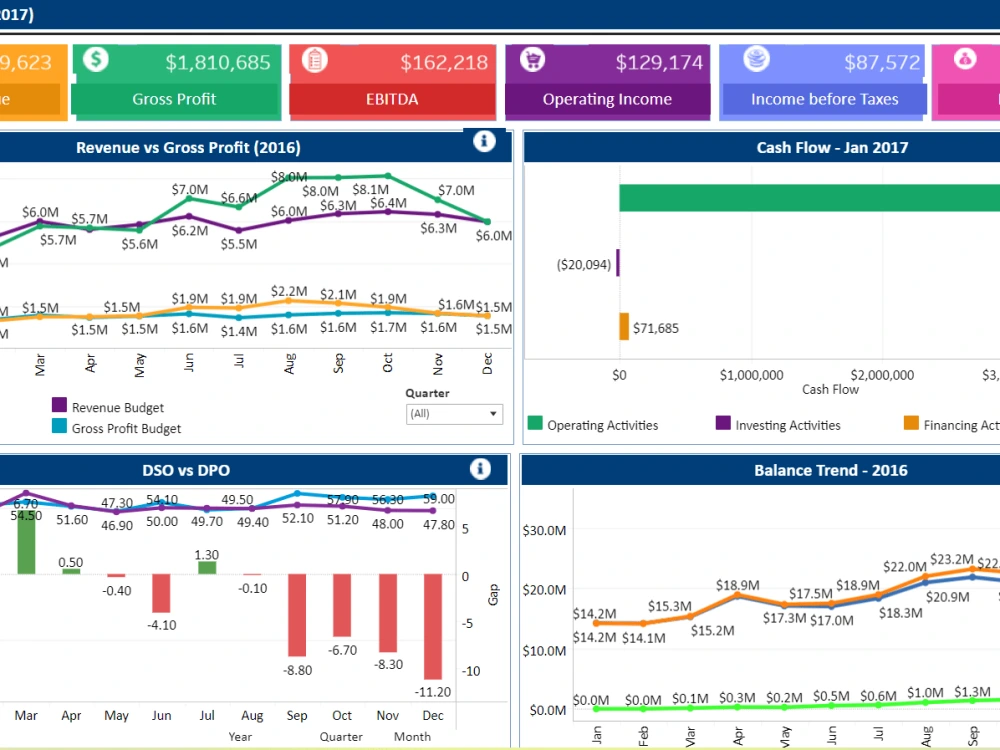
● Involved in creating tableau dashboards using stack bars, bar graphs, line charts,
scattered plots, geographical maps etc.
● Writing SQL queries to fetch the data and build a dashboard on top of it.
● Tested dashboards to ensure data was matching as per business requirements.
● Involved in maintenance of existing dashboards.
● Interacting with different stakeholders and resolving their issues on tableau dashboards
as and when tickets were raised on Service Now(SNOW).
● As a tableau site admin, actively involved in creation of users, groups, projects, adding
subscriptions, giving access to users.
● Worked on Tabcmd to set up email reports.
● Performed audit checks of multiple tableau reports and identified the bugs and fixed
them.
● Scheduled data refresh on tableau based on business requirements and ensured that
views and dashboards were displaying data accurately.
● Resolved P1 issues as and when raised by the client regarding tableau dashboards.
● Managed client communication and understanding the requirements of all the projects.
● QC the workbooks/dashboards that were developed before sharing it with clients.
● Involved in preparation of Business Review Document, UAT Document and Report
Requirement Document.
● Involved in Elicitation, Stakeholder Management and Client Management
● Liaise between business and technical personnel to ensure mutual understanding of
process and applications.
● Responsible for deriving insights from the dashboard and making interactive
presentations for WBR, QBR, MBR and presenting to different stakeholders.
● I’ll fully project manage your brief from start to finish
● Regular communication is really important to me, so let’s keep in touch!”
Steps for completing your project
After purchasing the project, send requirements so Andrean can start the project.
Delivery time starts when Andrean receives requirements from you.
Andrean works on your project following the steps below.
Revisions may occur after the delivery date.
Initial Discussion/Gathering Requirement
Discuss briefly the project requirements, dataset, and questions based on the requirements. Prepare a proposal based on the initial discussion.
First Draft and Discussion
After our initial discussion and requirement gathering, I will share the screenshot of how the dashboard would look like.