You will get Apple Stock Price Prediction Using Machine Learning & AI

Project details
Apple Stock Price Prediction | Python (XGBoost) 📈
Objective:
Leverage machine learning and time-series forecasting to predict Apple stock price trends with high accuracy.
Process & Implementation:
✅ Data Preparation:
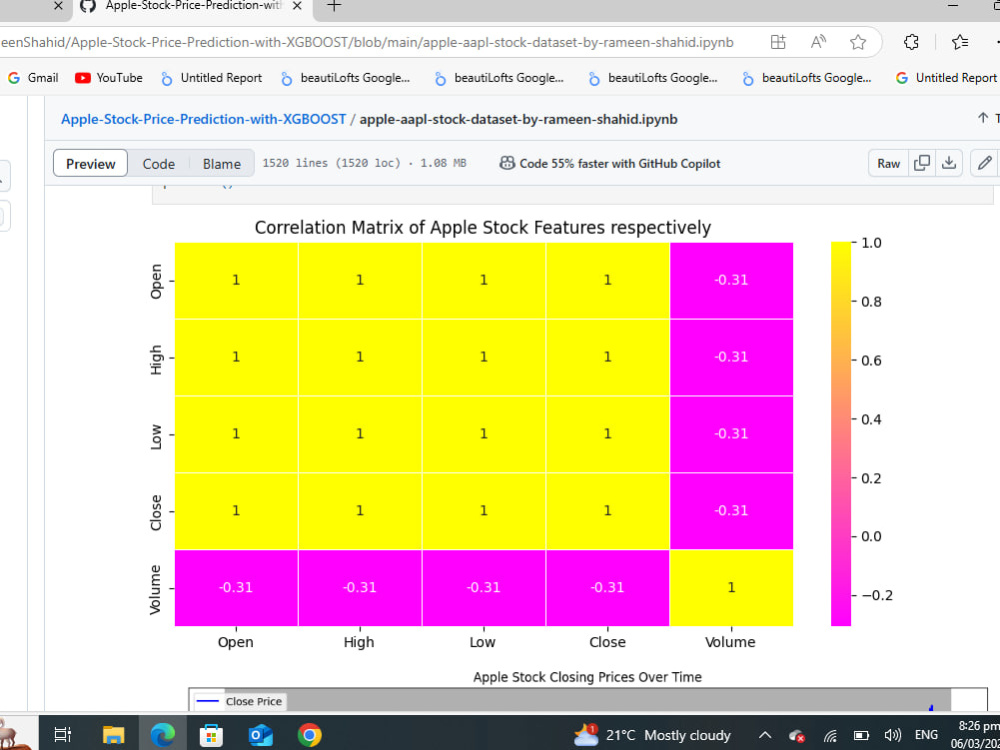
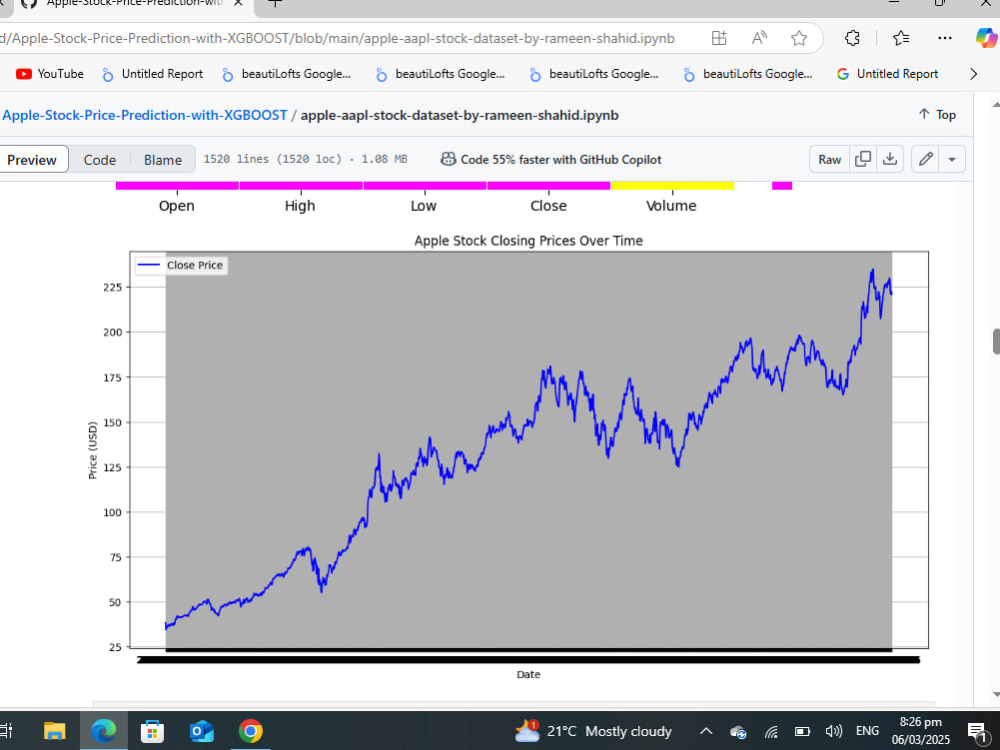
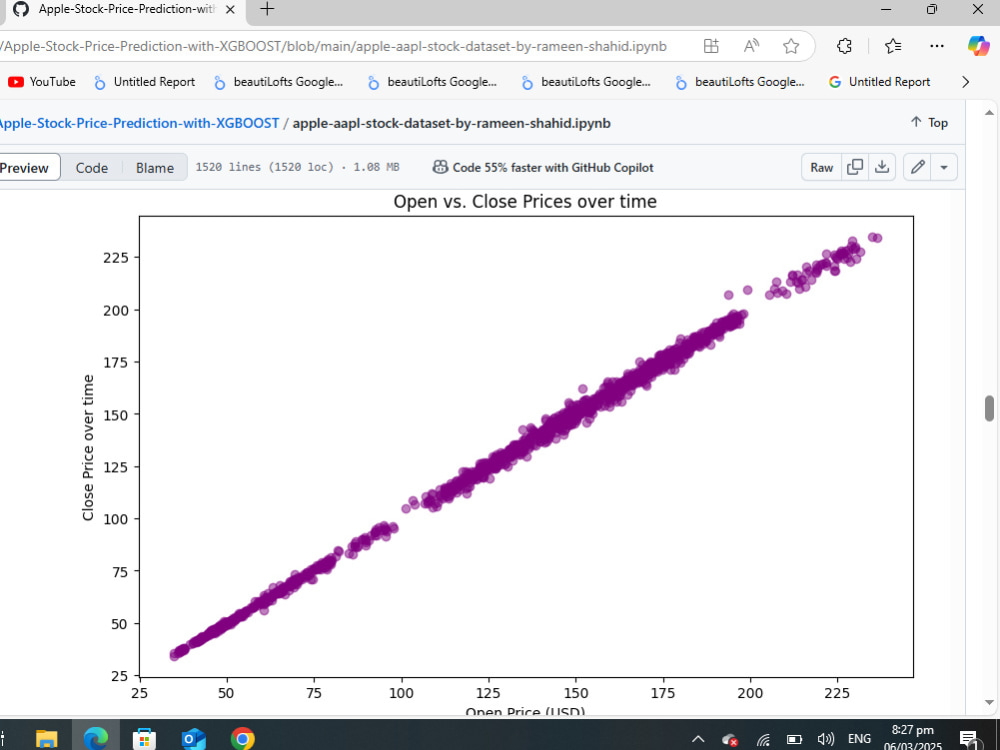
Collected and preprocessed historical stock data (Open, Close, High, Low, Volume).
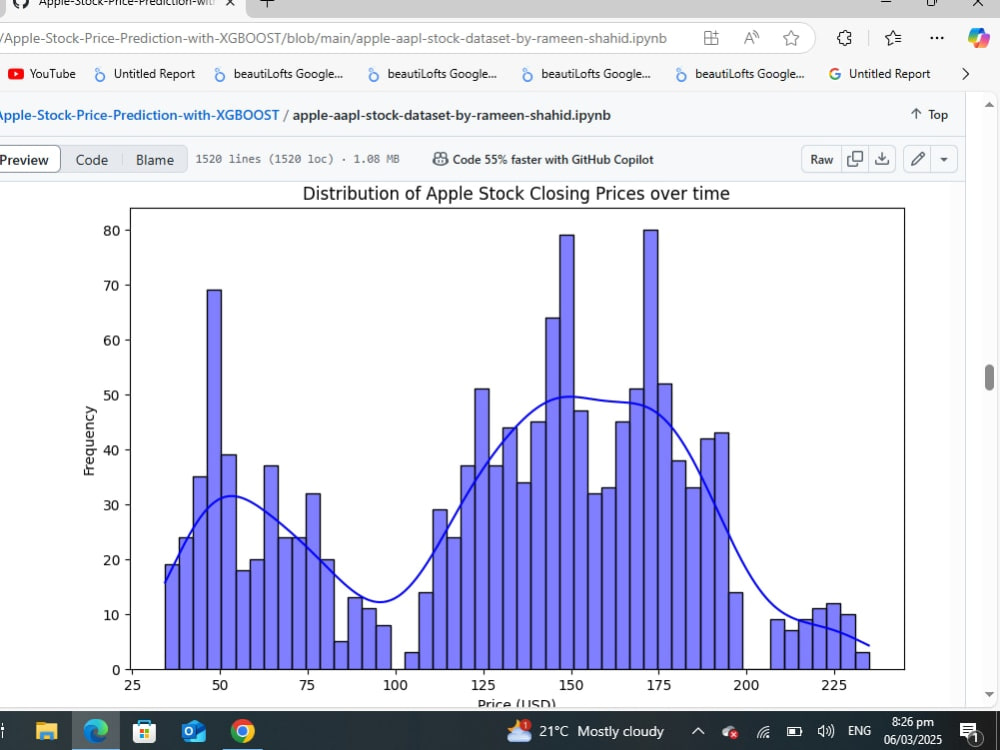
Scaled and normalized features for optimal model performance.
✅ Feature Engineering:
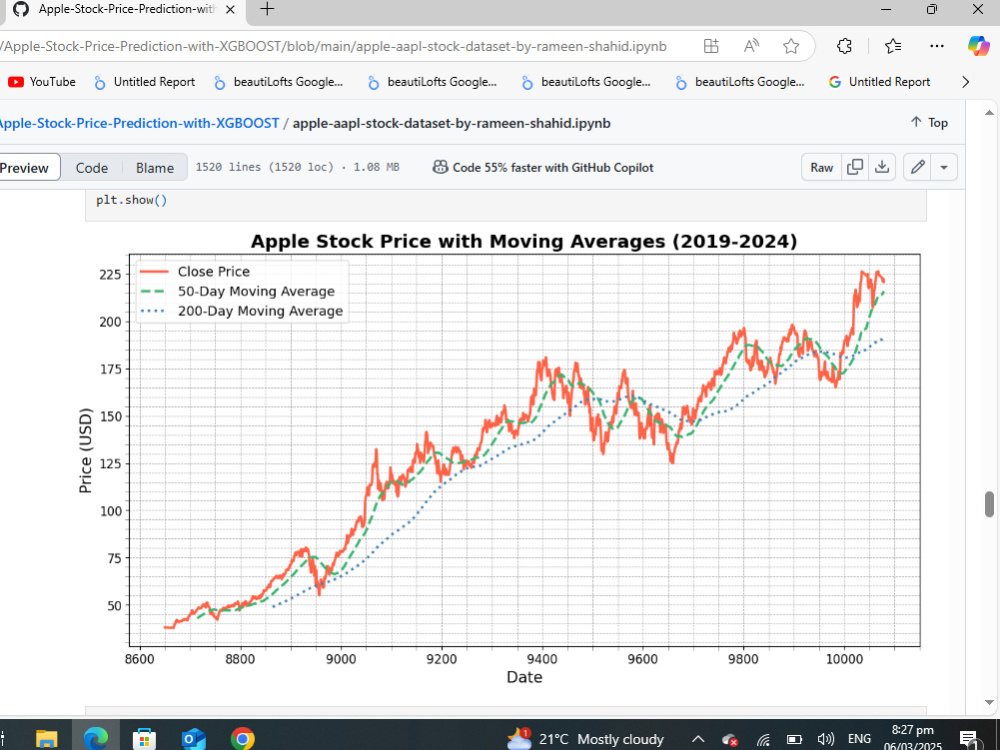
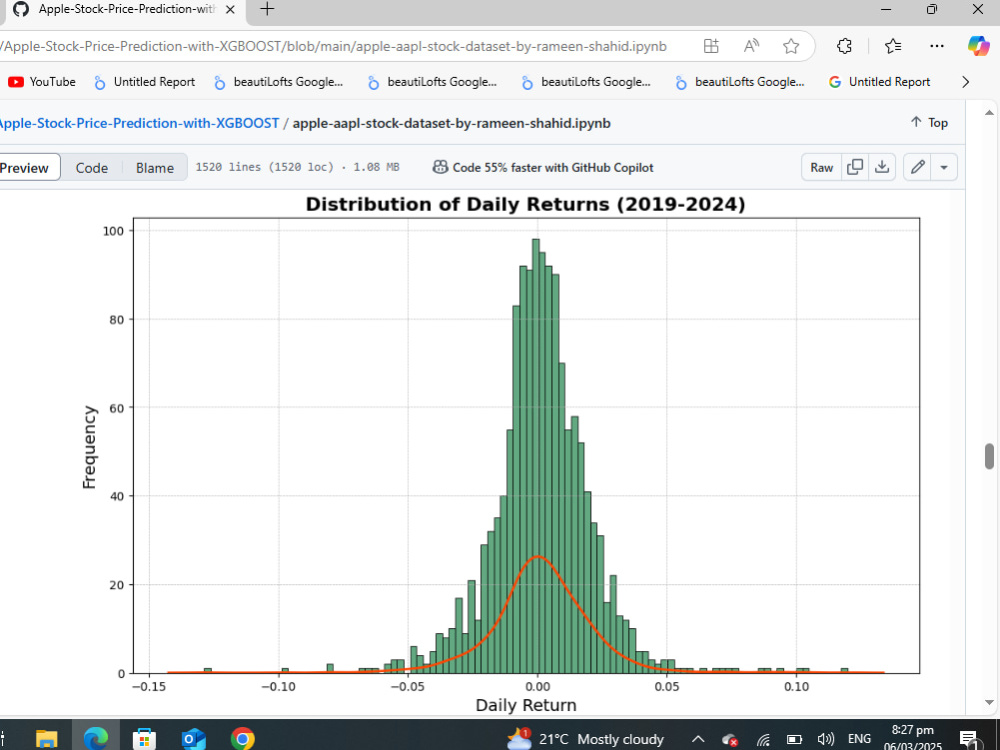
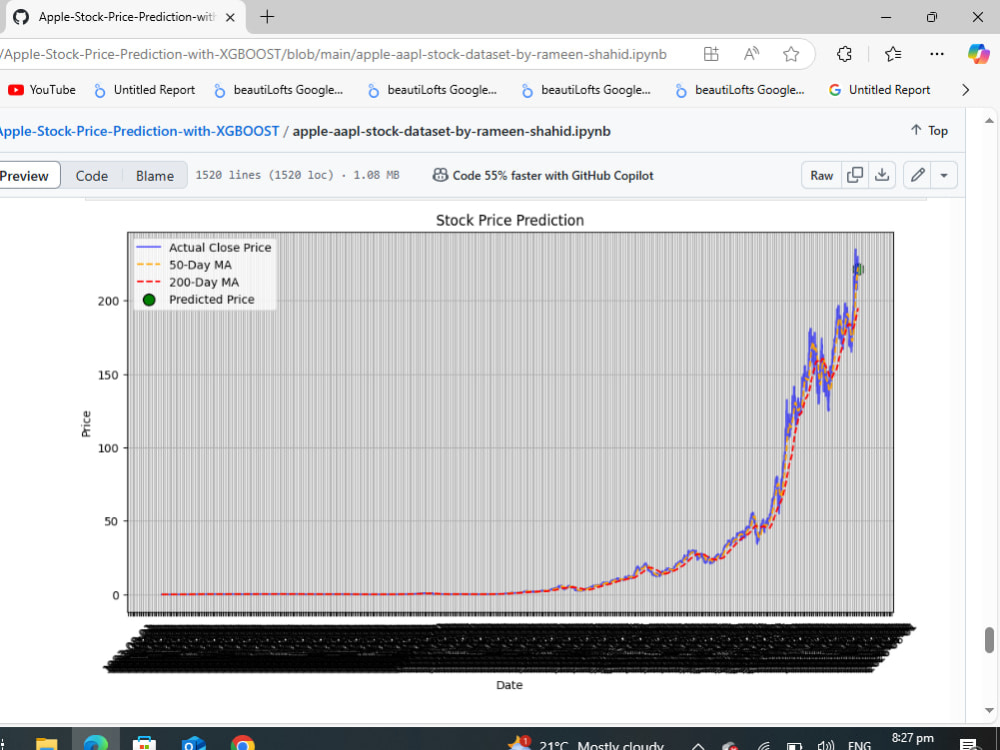
Created technical indicators like moving averages, returns, and volatility measures.
Incorporated lagged features to capture past trends influencing future prices.
✅ Model Training & Evaluation:
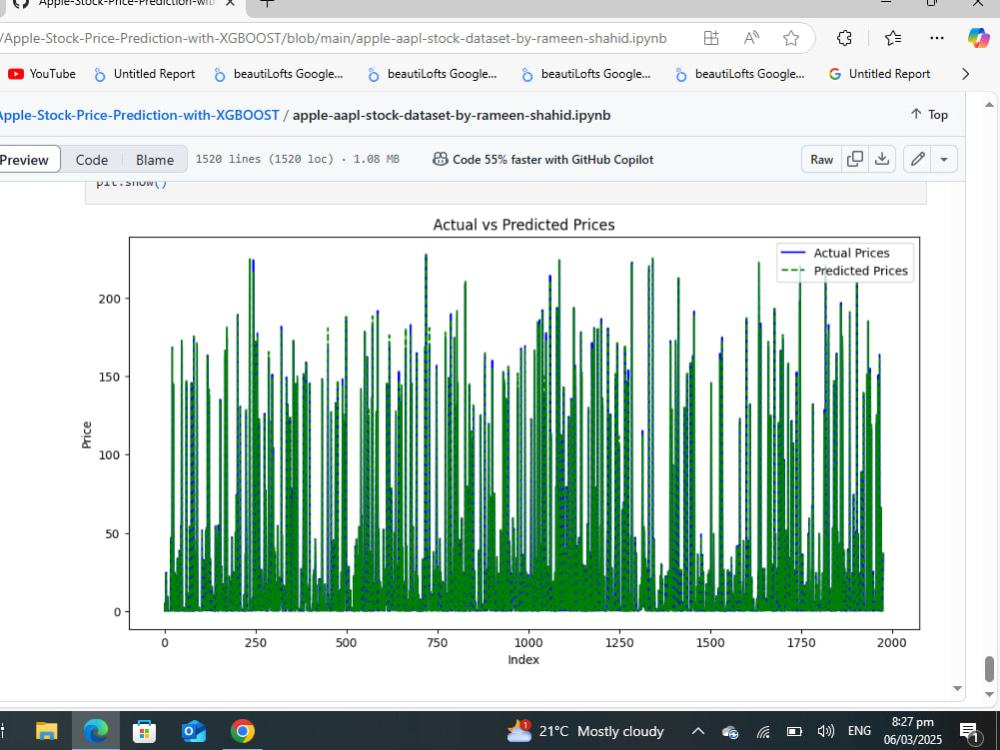
Trained an XGBoost regression model, fine-tuning hyperparameters for precision.
Evaluated performance using Mean Squared Error (MSE) and R² score, achieving highly accurate predictions.
Objective:
Leverage machine learning and time-series forecasting to predict Apple stock price trends with high accuracy.
Process & Implementation:
✅ Data Preparation:
Collected and preprocessed historical stock data (Open, Close, High, Low, Volume).
Scaled and normalized features for optimal model performance.
✅ Feature Engineering:
Created technical indicators like moving averages, returns, and volatility measures.
Incorporated lagged features to capture past trends influencing future prices.
✅ Model Training & Evaluation:
Trained an XGBoost regression model, fine-tuning hyperparameters for precision.
Evaluated performance using Mean Squared Error (MSE) and R² score, achieving highly accurate predictions.
Machine Learning Tools
AnyLogic, ChatGPT, Google Data Studio, Keras, Kubeflow, Microsoft Excel, Microsoft Power BI, NumPy, OpenCV, pandas, Python, Python Scikit-Learn, PyTorch, R, scikit-learn, SciPy, SPSS, SQL, Stata, Tableau, TensorFlow, XGBoostWhat's included
| Service Tiers |
Starter
$20
|
Standard
$30
|
Advanced
$40
|
|---|---|---|---|
| Delivery Time | 3 days | 4 days | 5 days |
Number of Revisions | 3 | 4 | 5 |
Number of Model Variations | 3 | 4 | 5 |
Number of Scenarios | 4 | 5 | 6 |
Number of Graphs/Charts | 6 | 10 | 15 |
Model Validation/Testing | |||
Model Documentation | |||
Data Source Connectivity | - | - | |
Source Code | - | - | - |
About Rameen
Data Scientist | Data Analyst | Business Analyst & Predictive ML
Peshawar, Pakistan - 5:50 pm local time
I’m Rameen Shahid, a data-driven professional specializing in Business Intelligence, Analytics, and Strategy. With a passion for uncovering insights from complex datasets, I help businesses optimize performance, drive revenue growth, and make informed decisions.
What I Do
I work with data visualization, performance tracking, and revenue analysis, using tools like Power BI, Tableau, SQL, R, and Python. My expertise lies in transforming raw data into actionable insights, helping businesses streamline operations and enhance decision-making.At Rameen Data Solutions, we specialize in database management, data analysis, and visualization, helping businesses transform raw data into actionable insights. Our expert team leverages cutting-edge technologies to store, manage, analyze, and visualize data efficiently, enabling smarter decision-making.
Tech & Skills
BI & Visualization: Power BI, Tableau, Google Data Studio
Data Analytics: SQL, Python (Pandas, Matplotlib), R (Tidyverse)
Business Strategy: Revenue forecasting, KPI tracking, performance optimization
Data Processing: Excel (Power Query, Pivot Tables), DAX, M Language
My Approach
I believe in data storytelling—turning numbers into meaningful narratives that drive action. Whether it’s analyzing revenue trends, understanding customer behavior, or optimizing processes, I focus on insights that deliver real business impact.
Our Services:
✔ Database Management – Secure, scalable, and optimized data storage solutions
✔ Data Analysis – Advanced analytics to uncover trends and opportunities
✔ Data Visualization – Interactive dashboards and reports for clear insights
✔ Business Intelligence – Data-driven strategies to boost performance
"Beyond the tools, I bring a problem-solving mindset—analyzing data trends, optimizing business processes, and providing insights that matter. Whether it’s revenue forecasting, journey analysis, or KPI tracking, I help businesses make smarter decisions."
Steps for completing your project
After purchasing the project, send requirements so Rameen can start the project.
Delivery time starts when Rameen receives requirements from you.
Rameen works on your project following the steps below.
Revisions may occur after the delivery date.
Data Collection & Preprocessing
Step 1: Data Collection & Preprocessing Gather historical Apple stock data (Open, Close, High, Low, Volume) from Yahoo Finance or Alpha Vantage. Handle missing values, remove outliers, and scale data for better model performance.
Feature Engineering
Step 2: Feature Engineering Create technical indicators (moving averages, RSI, MACD, Bollinger Bands). Add lagged features and calculate stock returns to capture trends.