You will get Cesium 3D WebGIS Dev – Underground Utility Network & Pipeline Visualization
Project details
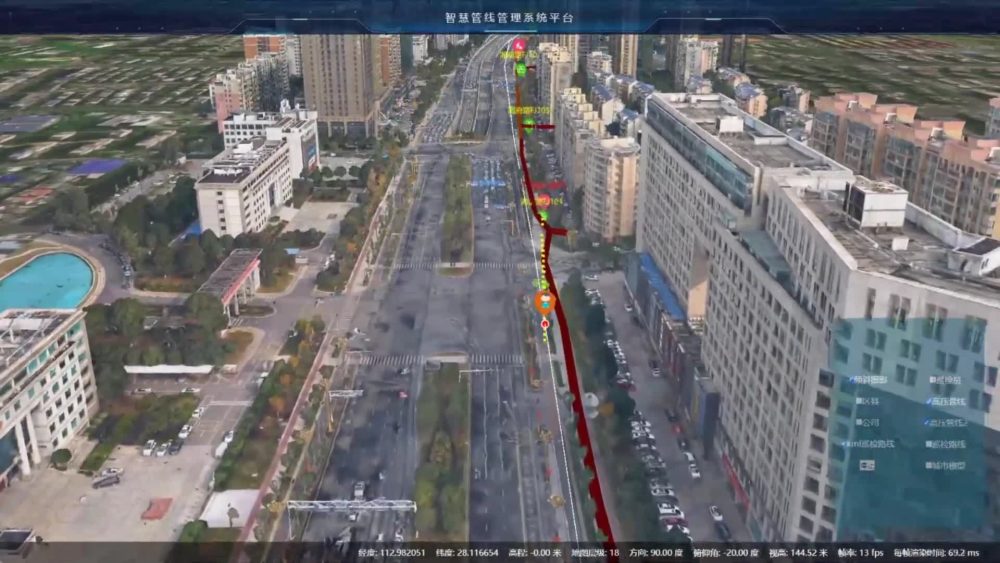
Unlike basic 2D maps, this project delivers a true 3D underground experience using Cesium’s globe. I don’t just visualize pipes – I enable depth‑based filtering, real‑time burst analysis, and valve isolation tracking. With 5+ years in GIS development, I turn raw utility data into interactive digital twins that work on any browser, with smooth terrain integration and support for 100K+ pipe segments. You get clean code, Cesium best practices, and a demo you can show to stakeholders immediately.
Programming Languages
HTML & CSS, JavaScript, C#Coding Expertise
Cross Browser & Device Compatibility, LocalizationWhat's included
| Service Tiers |
Starter
$200
|
Standard
$2,000
|
Advanced
$20,000
|
|---|---|---|---|
| Delivery Time | 10 days | 30 days | 60 days |
Number of Revisions | 3 | 5 | 5 |
Number of Pages | 1 | 1 | 1 |
Design Customization | |||
Content Upload | |||
Responsive Design | |||
Source Code |
About Fly
gis cesium dev
Dongying, China - 3:10 am local time
Geographic Information Systems (GIS) allow us to capture, store, analyze, and visualize spatial data. Over the years, GIS has evolved from static desktop maps to dynamic 3D web applications.
Cesium is a leading open-source JavaScript library for creating 3D globes and 2D maps in the browser. It leverages WebGL to render massive geospatial datasets with high performance, enabling developers to build applications that display terrain, imagery, 3D buildings, point clouds, and real-time data streams.
Key Features of Cesium for GIS Development:
3D Globe & 2D Map – seamless switching between perspectives.
Time-dynamic visualization – animate data over time (e.g., moving objects, weather).
Terrain & Imagery – supports Cesium World Terrain, Bing Maps, OpenStreetMap, and custom sources.
3D Tiles – an open standard for streaming massive 3D content (buildings, trees, point clouds).
High precision – handles real-world coordinates (WGS84) and large-scale scenes.
Integration – works with modern frameworks like React, Vue, Angular, and with GIS servers (GeoServer, ArcGIS, etc.).
Common Use Cases:
Urban planning and digital twins
Environmental monitoring (flood, fire simulation)
Defense and aerospace (flight tracking, satellite visualization)
Real estate and infrastructure management
Developers often combine Cesium with GIS backends (PostGIS, GeoServer) and data formats (GeoJSON, KML, Shapefile, 3D Tiles) to build complete web-based GIS solutions.
Steps for completing your project
After purchasing the project, send requirements so Fly can start the project.
Delivery time starts when Fly receives requirements from you.
Fly works on your project following the steps below.
Revisions may occur after the delivery date.
Load & Validate Utility Data
Convert client’s pipeline data (GeoJSON/Shapefile/KML) to Cesium-compatible format. Verify spatial reference (WGS84) and attribute fields (depth, diameter, material). Identify any missing or corrupted features before visualization.
Build 3D Underground Scene
Set up Cesium globe with terrain and underground mode (disable depth test for below-surface viewing). Style pipes by type/color, add click-to-query popups. Implement layer toggles for water, gas, electric networks.