You will get Clean, Analyze, and Visualize Data in Excel or Google Sheets
Project details
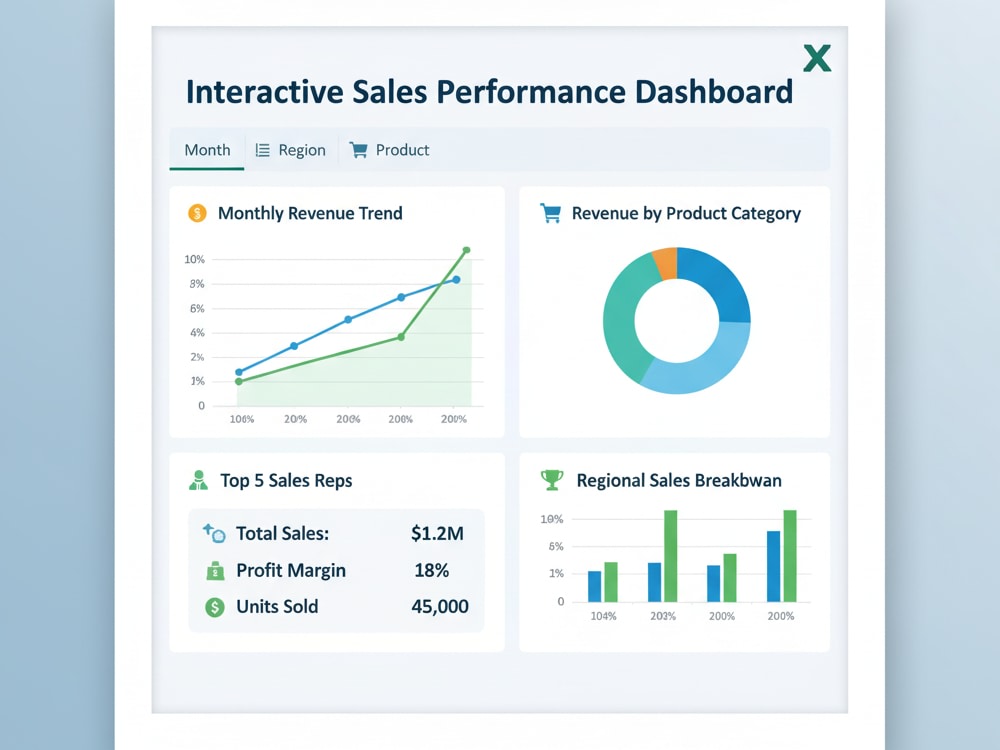
I help businesses and organizations turn raw data into clear, actionable insights using Excel and Google Sheets. I clean, organize, and transform datasets, create formulas, pivot tables, and charts to uncover trends and patterns. I build interactive dashboards to track KPIs, visualize performance, and support data-driven decision-making. My focus is on accuracy, clarity, and usability, ensuring stakeholders can quickly understand key metrics and take informed actions. Whether analyzing sales, operations, or survey data, I deliver end-to-end solutions tailored to your goals.
Data Tool
Microsoft ExcelWhat's included
| Service Tiers |
Starter
$50
|
Standard
$150
|
Advanced
$400
|
|---|---|---|---|
| Delivery Time | 3 days | 5 days | 7 days |
Number of Revisions | 1 | 2 | 5 |
Optional add-ons
You can add these on the next page.
Fast Delivery
+$100 - $800
Additional Revision
+$150About Thabo
Data Analyst | SQL, Power BI & Python for Data Cleaning and Dashboards
Pretoria, South Africa - 2:08 am local time
SQL – writing queries to extract, clean, and validate data.
Power BI – building interactive dashboards with KPIs, filters, maps, and trend analysis.
Python (Pandas & NumPy) – automating data cleaning, fixing errors, and preparing large datasets for reporting.
I’ve built dashboards for sales managers, national projects, and local businesses, always focusing on accuracy and clarity. If your data is messy, inconsistent, or hard to interpret, I can transform it into a clear story that supports real business decisions.
I keep communication simple, deliver on time, and make sure you walk away with insights you can actually use.
Steps for completing your project
After purchasing the project, send requirements so Thabo can start the project.
Delivery time starts when Thabo receives requirements from you.
Thabo works on your project following the steps below.
Revisions may occur after the delivery date.
Data Cleaning & Preparation
Organize raw data, remove duplicates, standardize formats, and create formulas or pivot tables for analysis
Reporting & Visualization
Build interactive dashboards, charts, and summary tables to deliver clear insights and actionable results.