You will get clean and visualize your dataset using R
Project details
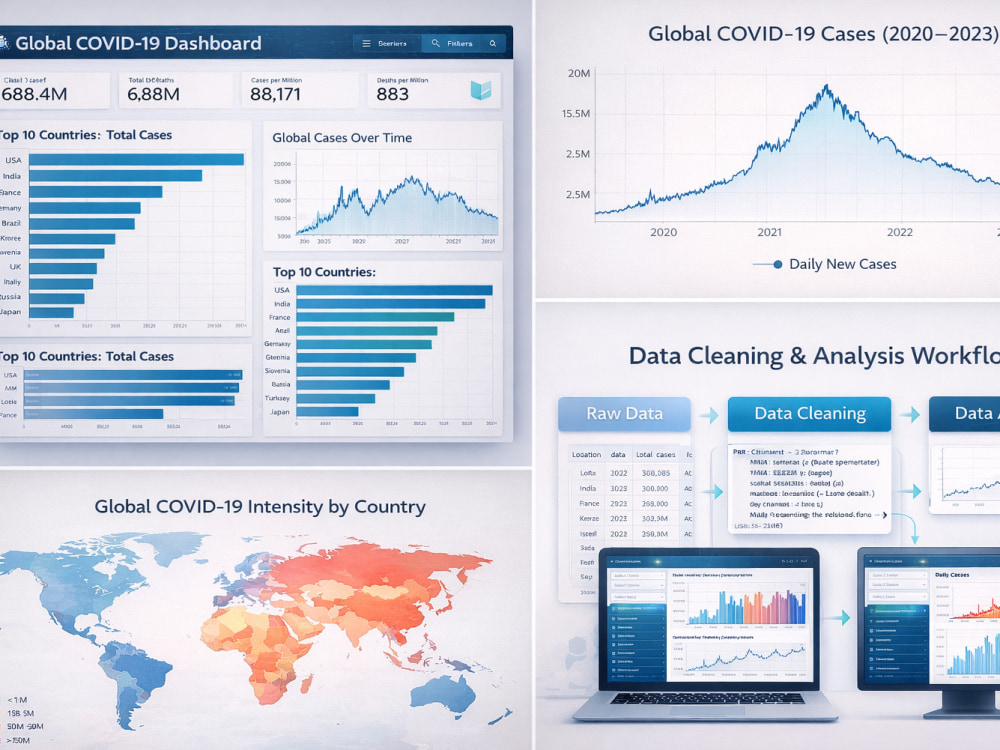
You will get clean, structured, and insight-driven data analysis using R and ggplot2 that transforms raw data into meaningful business insights. I specialize in data cleaning, exploratory data analysis (EDA), statistical analysis, and professional visualizations tailored to your project goals.
With hands-on experience in real-world data projects including global COVID-19 trend analysis and interactive dashboards, I follow a clear and systematic workflow: data preprocessing, quality checks, analysis, visualization, and structured reporting.
I focus on accuracy, clarity, and modern visual design. All charts are created using ggplot2 with clean themes, clear labeling, and publication-ready formatting.
Whether you need business insights, academic analysis, or interactive dashboards, I deliver high-quality, original, and well-documented work that helps you make better data-driven decisions.
Data Tool
RWhat's included
| Service Tiers |
Starter
$15
|
Standard
$30
|
Advanced
$45
|
|---|---|---|---|
| Delivery Time | 2 days | 3 days | 3 days |
Number of Revisions | 2 | 3 | 4 |
Number of Pages Mined/Scraped | 0 |
Optional add-ons
You can add these on the next page.
Fast Delivery
+$2 - $10
Additional Revision
+$2About Bushra
I will be your best data analyst & data visualization using (Python R)
Islamabad, Pakistan - 8:45 am local time
I specialize in transforming raw and complex datasets into meaningful, visually compelling, and easy-to-understand visuals. From static charts to interactive Plotly dashboards, every visualization is carefully designed to highlight insights that support smart decision-making.
With experience as a freelance data analyst, I have successfully completed numerous data visualization and analysis projects across different domains. My strong command of R, ggplot2, allows me to deliver visuals that are both aesthetically appealing and analytically accurate.
When you work with me, you can expect:
Clean, professional, and insightful visualizations
Clear communication of findings for management & stakeholders
High-quality work with attention to detail
On-time delivery and full client satisfaction
I am confident you will enjoy working with me, and I look forward to helping you turn your data into impactful insights.
Steps for completing your project
After purchasing the project, send requirements so Bushra can start the project.
Delivery time starts when Bushra receives requirements from you.
Bushra works on your project following the steps below.
Revisions may occur after the delivery date.
Data Cleaning & Preprocessing
I will clean the dataset by handling missing values, removing duplicates, correcting formats, transforming variables, and preparing structured data for accurate analysis.