You will get Clean, Interactive Excel Dashboard (KPIs, Charts, Slicers)
Project details
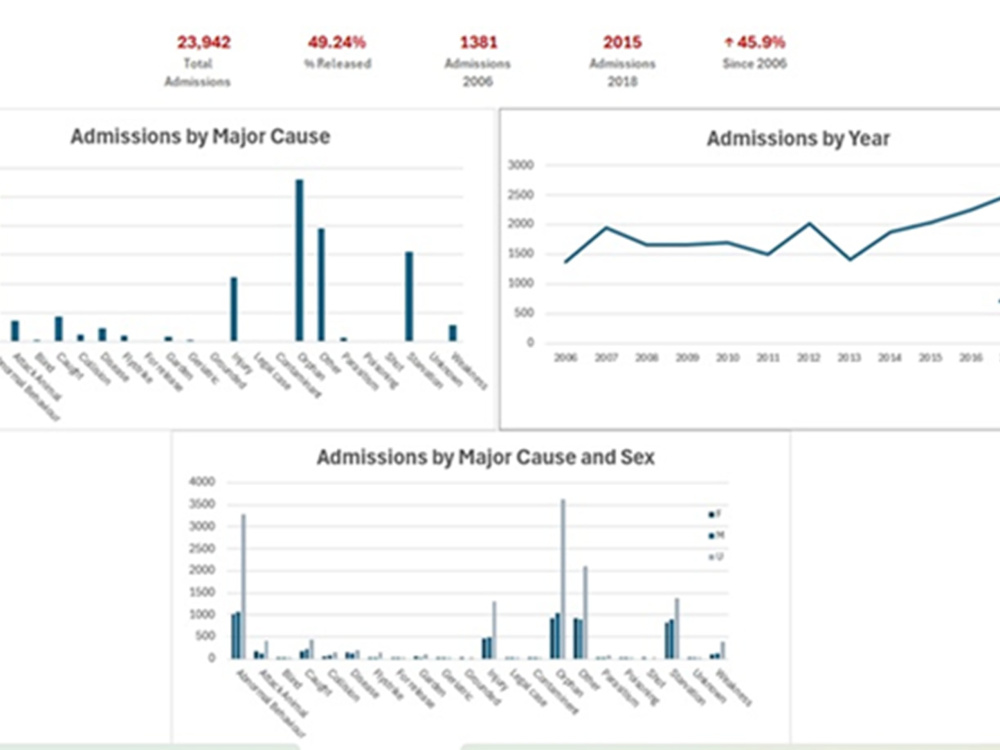
I design clean, simple, interactive Excel dashboards that make your data easy to understand. I work with raw or messy datasets and transform them into clear visuals, KPIs and insights. Your dashboard will be fully custom, easy to update, and designed to help you make fast, confident decisions.
Data Tool
Microsoft ExcelWhat's included
| Service Tiers |
Starter
$35
|
Standard
$80
|
Advanced
$200
|
|---|---|---|---|
| Delivery Time | 3 days | 4 days | 6 days |
Number of Revisions | 1 | 2 | 3 |
Optional add-ons
You can add these on the next page.
Additional Revision
+$10Frequently asked questions
About Rae
Data & Research Support (MSc)
Dorking, United Kingdom - 12:03 am local time
Recent work includes supporting system migrations, preparing reporting dashboards, and editing biology-focused articles to meet academic standards. I’m comfortable working in Excel, R, Python and SQL, and I regularly proofread and paraphrase scientific material to reduce similarity while preserving meaning.
My focus is clarity, accuracy and reliable delivery—whether the task is technical, editorial or research-based.
Steps for completing your project
After purchasing the project, send requirements so Rae can start the project.
Delivery time starts when Rae receives requirements from you.
Rae works on your project following the steps below.
Revisions may occur after the delivery date.
Review your data and clean/standardise it if needed
Create pivot tables and data model