You will get Clean & Transform Raw Data Using SQL for BI Dashboards
Rising Talent
Project details
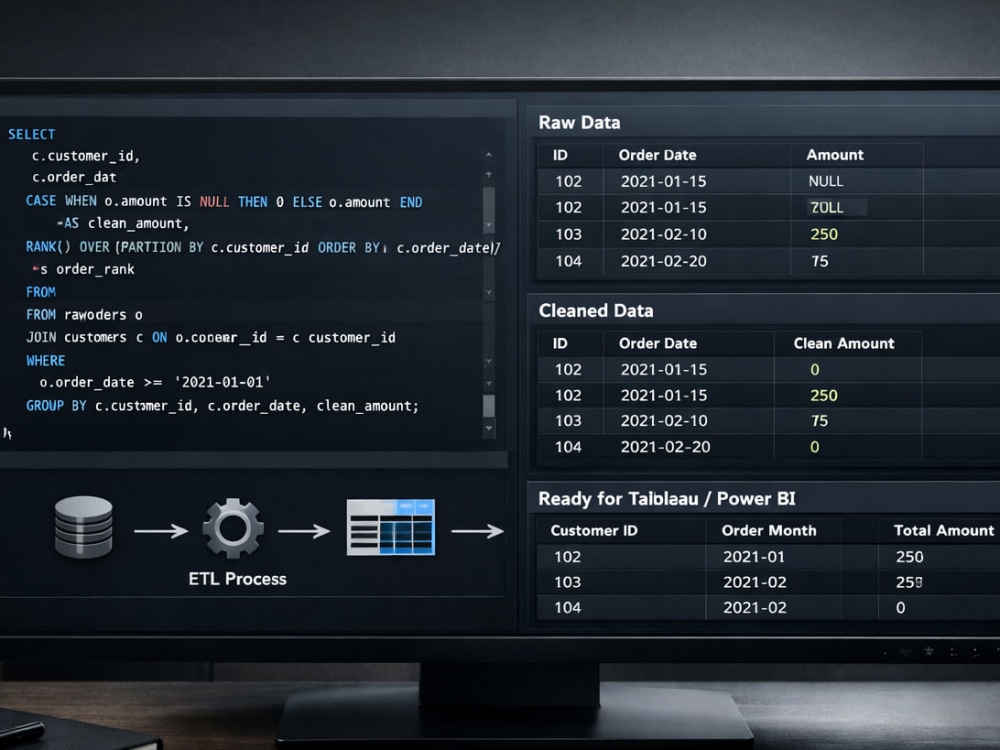
Messy data leads to broken dashboards and incorrect insights. I will clean, standardize, and transform your raw data using SQL so it’s ready for Tableau or Power BI reporting.
Accuracy first. Performance always.
What you’ll get:
• SQL data cleaning logic
• Duplicate & null handling
• Date & metric standardization
• Output tables ready for BI tools
• Optimized queries for performance
Tools: SQL (any major database)
Best for: Analysts, BI teams, reporting pipelines
Accuracy first. Performance always.
What you’ll get:
• SQL data cleaning logic
• Duplicate & null handling
• Date & metric standardization
• Output tables ready for BI tools
• Optimized queries for performance
Tools: SQL (any major database)
Best for: Analysts, BI teams, reporting pipelines
Data Tool
SQLWhat's included
| Service Tiers |
Starter
$20
|
Standard
$40
|
Advanced
$80
|
|---|---|---|---|
| Delivery Time | 3 days | 5 days | 7 days |
Number of Revisions | 1 | 2 | 3 |
Source Code |
6 reviews
(6)
(0)
(0)
(0)
(0)
This project doesn't have any reviews.
PC
P C.
Nov 30, 2025
Make a custom Google Sheet with locked formulas graphs and logos
Spreadsheet expert! Very good and briniging my vision to life
MU
Mohamed U.
Dec 2, 2024
You will get Tableau Data Analytics/Data Visualization Dashboard or Report
PM
Parter M.
Nov 29, 2024
You will get Tableau Data Analytics/Data Visualization Dashboard or Report
helpful
PM
Parter M.
Nov 28, 2024
You will get insightful tableau, looker, power bi, excel dashboard
Professional Work , Very Kind and i would like to work with him in the future
FM
Fouad M.
Nov 26, 2024
Tableau dashboard
Great job! Fast delivery and quality work. Highly recommended.
About Ali
Tableau & Power BI Expert | Data Visualization & Dashboards | Analyst
100%
Job Success
Lahore, Pakistan - 7:15 am local time
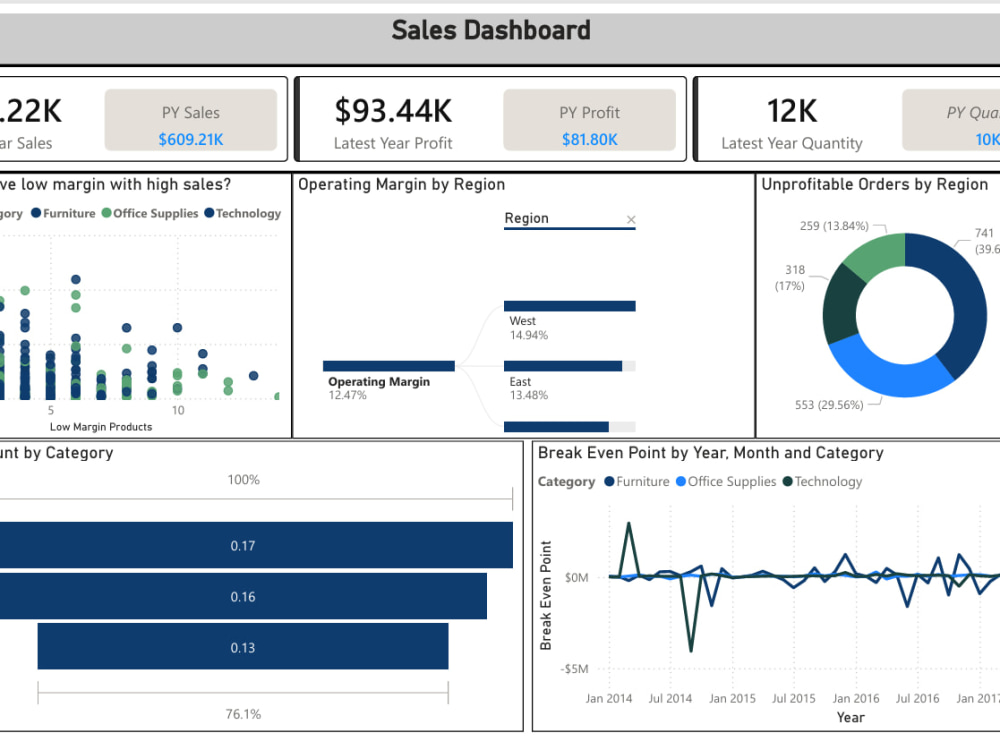
⚡️Struggling with messy data or boring reports? I transform raw data into stunning Tableau and Power BI dashboards that drive informed decisions, not confusion.
I help businesses, consultants & agencies extract meaning from data using clear visual storytelling and automation with tools like Power BI, Tableau, SQL, and Excel.
🔑 What I Deliver:
Interactive dashboards (KPI, sales, finance, operations)
End-to-end setup: data prep → modeling → visuals
Power BI DAX, M queries, and scheduled refreshes
Tableau LODs, data blending, and storytelling
SQL-based reporting and ETL pipelines
💼 Worked With:
SaaS Startups, Agencies, Retail, Finance, Health Tech
🚀 Why Clients Love Working With Me:
🔍 100% accuracy & attention to data integrity
🧠 Problem-solver mindset
📞 Easy, clear communication
⏱️ Fast delivery, always on time
📌 Let’s simplify your data. Drop me a message and I’ll show you how.
Steps for completing your project
After purchasing the project, send requirements so Ali can start the project.
Delivery time starts when Ali receives requirements from you.
Ali works on your project following the steps below.
Revisions may occur after the delivery date.
Requirements and alignment
Once I get the requirements, I will understand the full scope and then will share the proper plan with the client before proceeding.