You will get Cleaning and Transforming Dirty Datasets for Analysis Using Excel/Power Bi
Project details
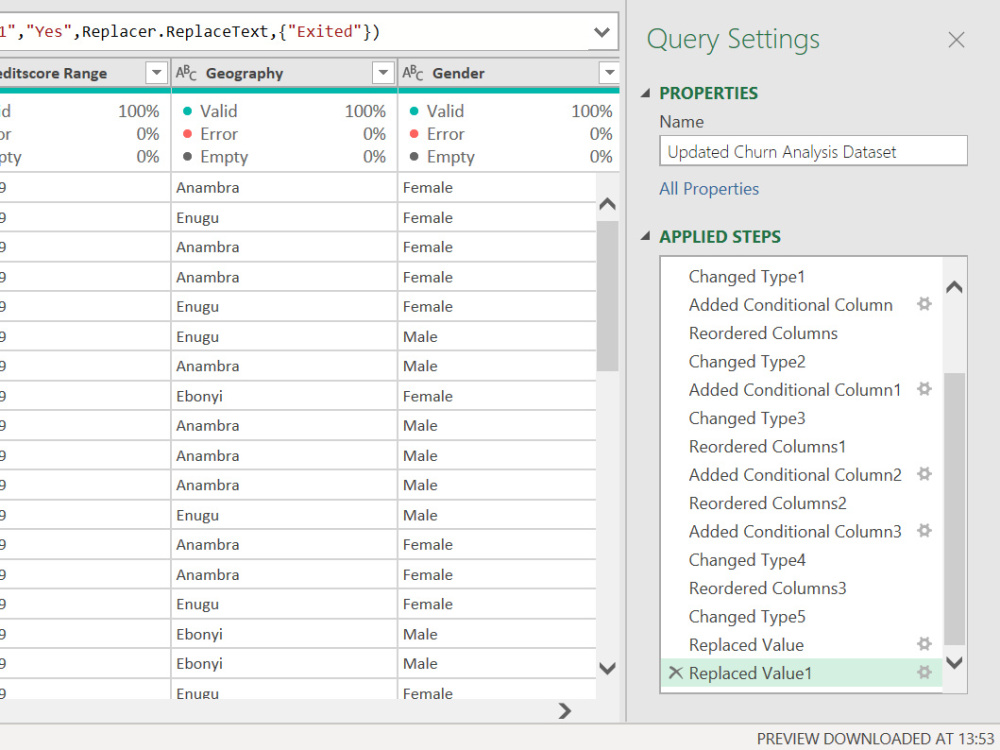
This project focused on cleaning and preparing a raw dataset using Microsoft Excel to ensure accuracy, consistency, and readiness for business analysis. The dataset initially contained several quality issues such as missing values, duplicate entries, inconsistent date formats, and irregular text inputs that could affect the validity of insights.
Using Excel’s powerful data preparation tools — including Data Validation, Conditional Formatting, Text-to-Columns, Find & Replace, and Pivot Tables — I systematically identified and corrected data errors. I also applied formulas and logical functions (such as IF, TRIM, PROPER, and VLOOKUP) to standardize and cross-check information across the dataset.
By the end of the process, the dataset was fully cleaned, structured, and analysis-ready, providing a solid foundation for generating accurate business reports and dashboards.
Outcome:
• Produced a clean, reliable, and structured dataset for analysis.
• Improved data accuracy and consistency by eliminating errors.
• Enhanced reporting efficiency through structured tables and validated inputs.
• Built a foundation for future data visualization and business intelligence projects.
Data Tool
Microsoft ExcelWhat's included
| Service Tiers |
Starter
$50
|
Standard
$100
|
Advanced
$200
|
|---|---|---|---|
| Delivery Time | 7 days | 7 days | 5 days |
Number of Revisions | 1 | 2 | 3 |
Number of Pages Mined/Scraped | 1 | 10 | 15 |
Number of Sources Mined/Scraped | 1 | 10 | 15 |
About Lukman
Data Analyst
Ibadan, Nigeria - 12:11 am local time
data into meaningful insights that drive smarter decisions. With
experience in Power BI and Excel, I've developed skills in data
preparation, data modeling, analysis, visualization, and reporting.
What excites me most is turning complex datasets into clear,
engaging dashboards that not only tell a story but also empower
organizations to act with confidence. I enjoy uncovering patterns,
simplifying processes, and presenting insights in ways that resonate
with both technical and non-technical audiences.
As I continue to build my career in data analytics, I'm eager to
collaborate with teams, solve real-world business problems, and
expand my expertise in advanced analytics and data-driven strategy.
Steps for completing your project
After purchasing the project, send requirements so Lukman can start the project.
Delivery time starts when Lukman receives requirements from you.
Lukman works on your project following the steps below.
Revisions may occur after the delivery date.
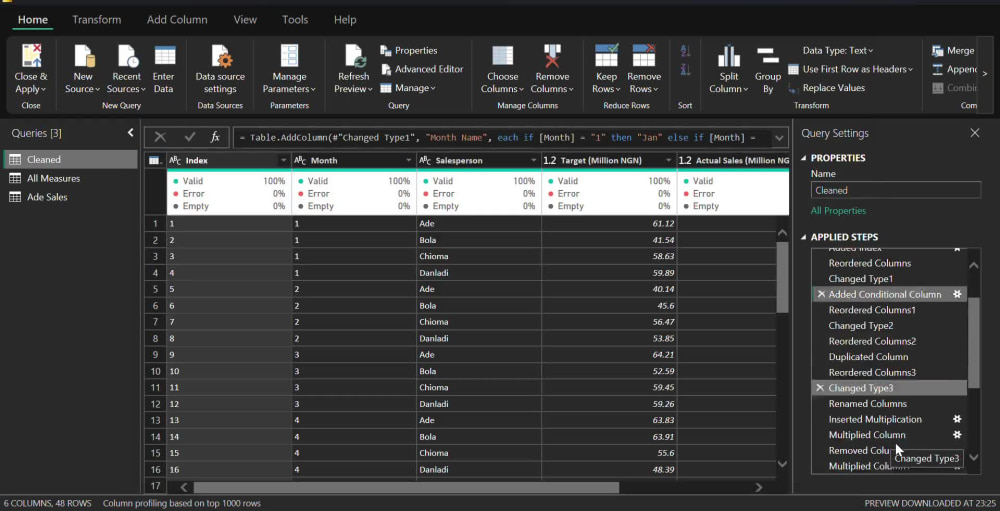
I will extract your data into power query
I will automate the data if required