You will get Complete Excel Reporting: Cleaning + Dashboard + Insights
Project details
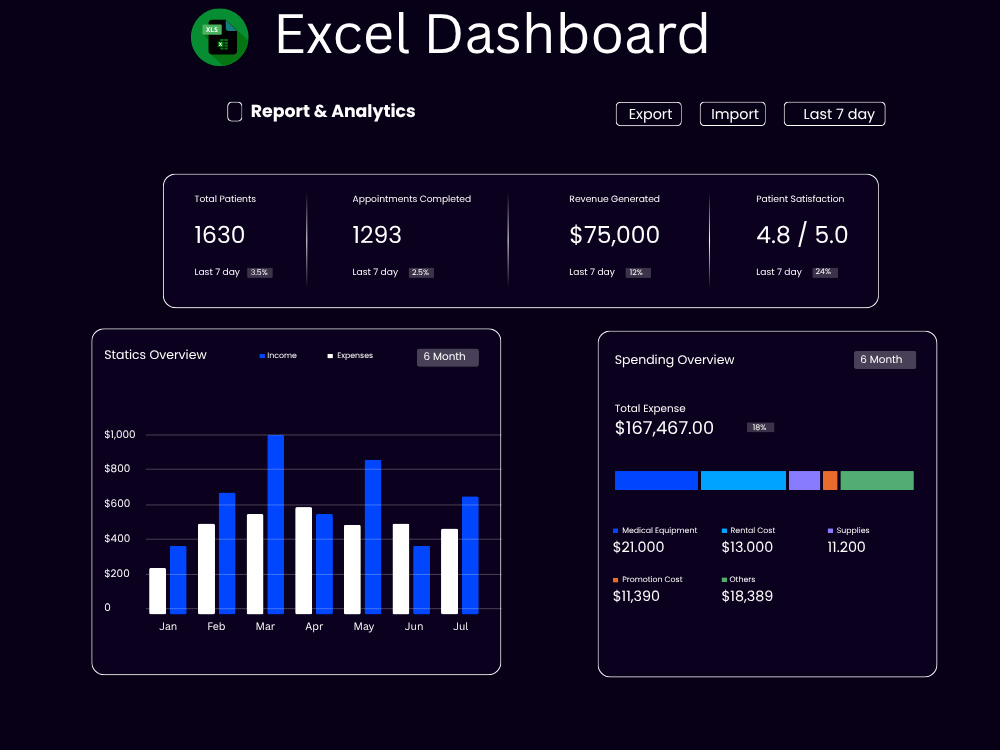
This project involves cleaning raw, unstructured data using Excel functions such as Power Query, text functions, conditional formatting, data validation, and pivot tables. After data cleaning, I designed a dynamic dashboard using slicers, pivot charts, KPIs, and interactive visuals. The dashboard highlights key insights such as sales trends, profit distribution, customer segmentation, and product performance. This project reflects my ability to transform messy data into actionable insights using Excel.
Data Tool
Microsoft ExcelWhat's included
| Service Tiers |
Starter
$13
|
Standard
$27
|
Advanced
$60
|
|---|---|---|---|
| Delivery Time | 1 day | 3 days | 5 days |
Number of Revisions | 0 | 1 | 3 |
Number of Pages Mined/Scraped | 2 | 5 | 8 |
Number of Sources Mined/Scraped | 1 | 2 | 3 |
Optional add-ons
You can add these on the next page.
Fast Delivery
+$10 - $25About Guneet
Data Analyst proficient in Power BI, Excel, and SQL, specializing
New Delhi, India - 1:34 pm local time
Steps for completing your project
After purchasing the project, send requirements so Guneet can start the project.
Delivery time starts when Guneet receives requirements from you.
Guneet works on your project following the steps below.
Revisions may occur after the delivery date.
I will check the website link or file you provide
I will create an interactive dashboard with charts, KPIs.