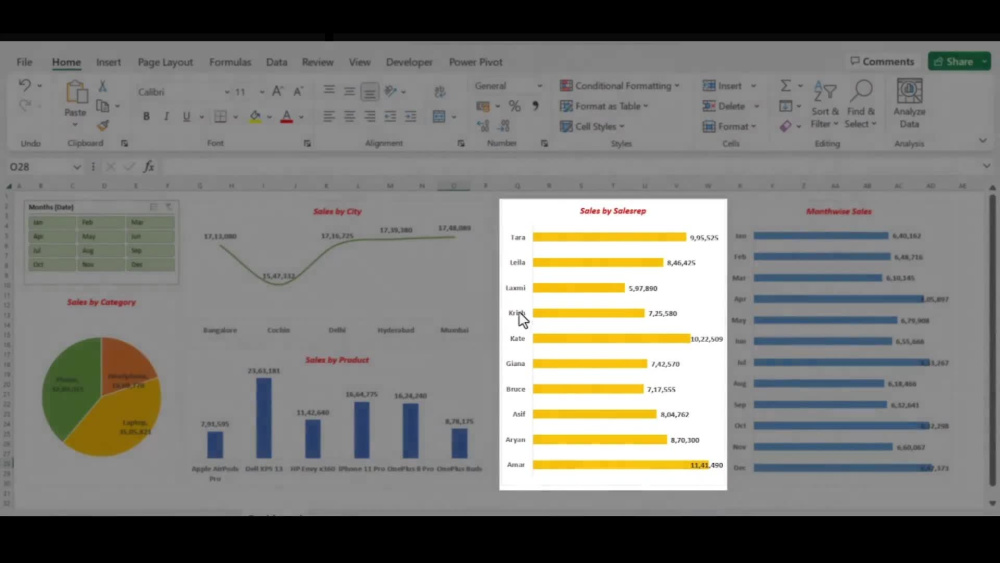
You will get create excel graphs,pivot tables,vlookup and dashboard

Project details
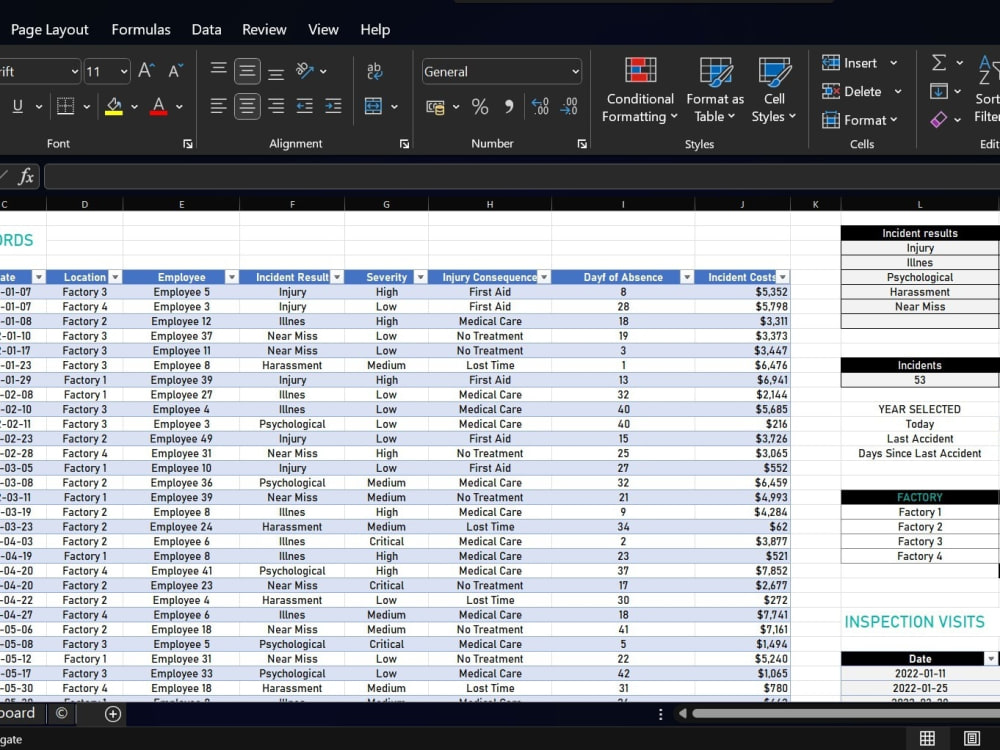
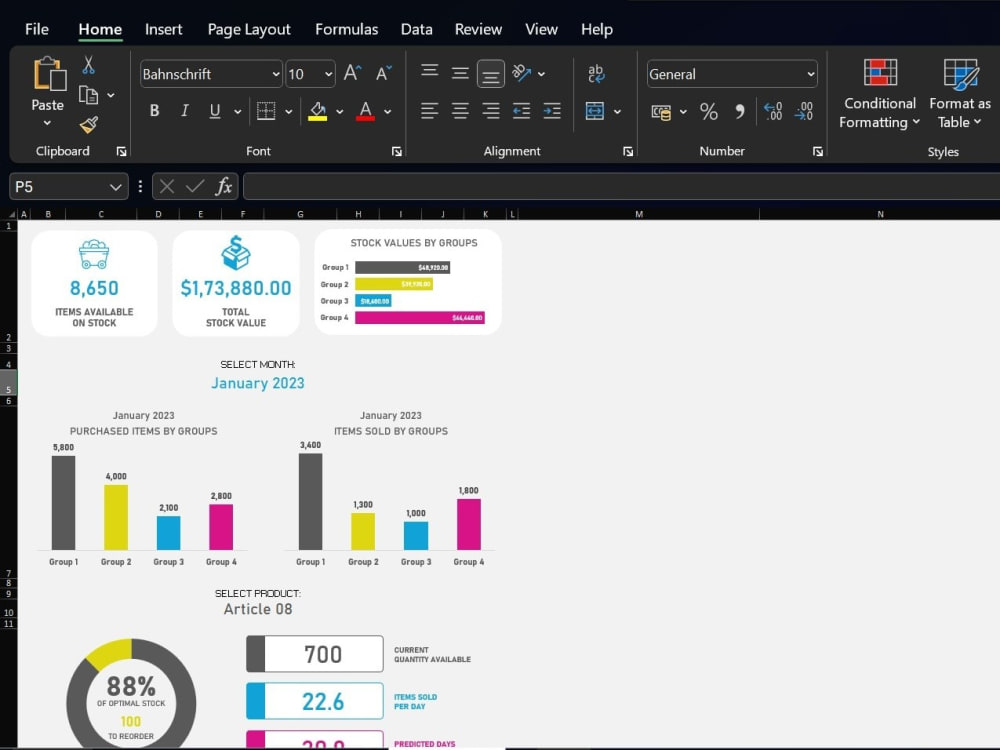
I am a Data Analyst with expertise in Excel, SQL, and Power BI, offering high-quality data analysis and business intelligence solutions. I specialize in working with Pivot Tables, Charts, Graphs, Data Validation, and Excel Dashboards to help businesses efficiently organize their data and improve decision-making.
With advanced proficiency in Power BI, I create dynamic and interactive reports and dashboards that turn complex data into actionable insights. I am an innovative, detail-oriented, and highly motivated professional committed to delivering solutions at affordable prices, helping clients streamline their data processes without breaking their budget.
With advanced proficiency in Power BI, I create dynamic and interactive reports and dashboards that turn complex data into actionable insights. I am an innovative, detail-oriented, and highly motivated professional committed to delivering solutions at affordable prices, helping clients streamline their data processes without breaking their budget.
Data Tool
Microsoft ExcelWhat's included
| Service Tiers |
Starter
$5
|
Standard
$10
|
Advanced
$25
|
|---|---|---|---|
| Delivery Time | 1 day | 1 day | 2 days |
Number of Revisions | 2 | Unlimited | Unlimited |
Optional add-ons
You can add these on the next page.
Additional Revision
+$5
Additional Page Mined/Scraped
(+ 1 Day)
+$5About Dhruv
Data Analyst & Dashboard Developer | Excel, Power BI, SQL Expert
Delhi, India - 11:30 am local time
I specialize in:
Data Analysis & Reporting: Turning raw data into actionable insights.
Excel: Advanced functions, formulas, pivot tables, and automation with macros.
Power BI: Designing interactive, custom dashboards and reports.
SQL: Writing efficient queries and optimizing databases for analysis.
My goal is to provide high-quality solutions..
Steps for completing your project
After purchasing the project, send requirements so Dhruv can start the project.
Delivery time starts when Dhruv receives requirements from you.
Dhruv works on your project following the steps below.
Revisions may occur after the delivery date.
Collect and Clean Data: Ensure all datasets are accurate and consistent.
Create Chart and Slicer: Build the chart with an interactive slicer.