You will get create responsive interactive data visualisations with chart.js ngx echart
Project details
I will develop responsive and interactive data visualisations for your website with chartJS, Echart or ngx-echart according to your choice.
Services I offer:
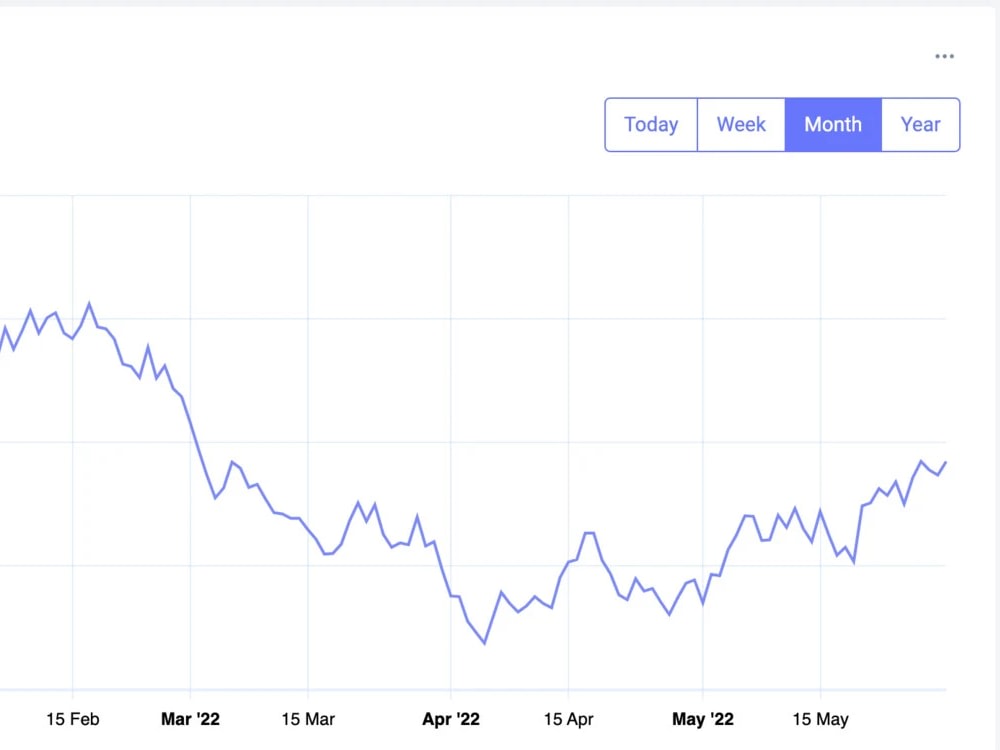
Line Charts
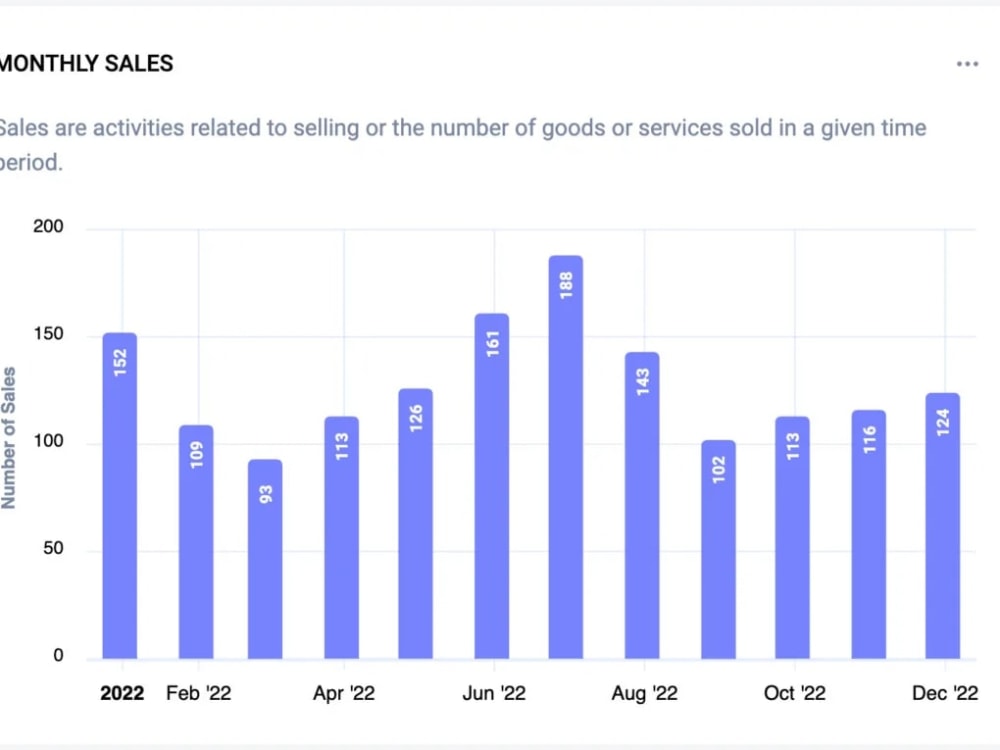
Bar Charts
Radar Charts
Doughnut and Pie Charts
Scatter Charts
Please contact me before placing your order to check my availability and discuss the feasibility of your project. This will help avoid the necessity of canceling your order.
Deliverables:
Angular app or HTML & JavaScript (Separate or Combined) according to your choice
Services I offer:
Line Charts
Bar Charts
Radar Charts
Doughnut and Pie Charts
Scatter Charts
Please contact me before placing your order to check my availability and discuss the feasibility of your project. This will help avoid the necessity of canceling your order.
Deliverables:
Angular app or HTML & JavaScript (Separate or Combined) according to your choice
Programming Languages
HTML & CSS, JavaScript, TypeScriptCoding Expertise
PSD to HTML, Performance Optimization, DesignWhat's included
| Service Tiers |
Starter
$20
|
Standard
$45
|
Advanced
$115
|
|---|---|---|---|
| Delivery Time | 1 day | 1 day | 1 day |
Number of Revisions | 1 | 2 | 1 |
Number of Pages | 1 | 3 | 8 |
Design Customization | |||
Content Upload | - | - | - |
Responsive Design | |||
Source Code |
About Yahya
Software engineer JavaScript | NodeJs | Angular | React
Mohammedia, Morocco - 1:36 am local time
Steps for completing your project
After purchasing the project, send requirements so Yahya can start the project.
Delivery time starts when Yahya receives requirements from you.
Yahya works on your project following the steps below.
Revisions may occur after the delivery date.
Design
If you have a specific design in mind, please provide it to me in either a Figma or an image format.The final deliverable should be either a JavaScript file or an Angular app