You will get Credit Card Fraud Detection with Random Forest & Explainable AI (SHAP)
Project details
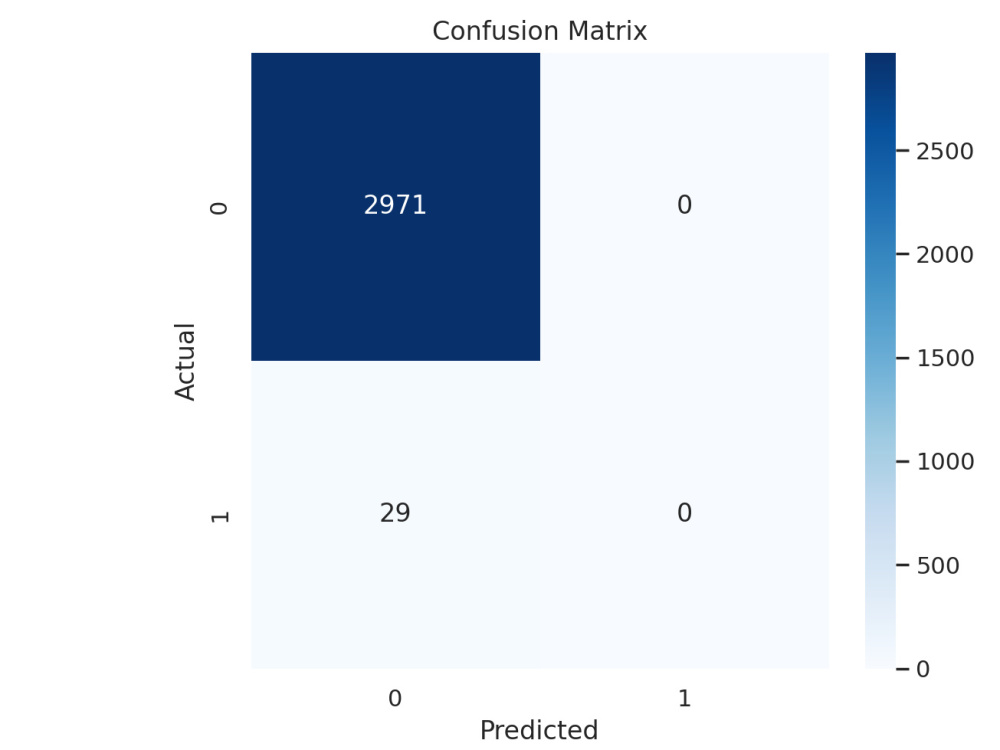
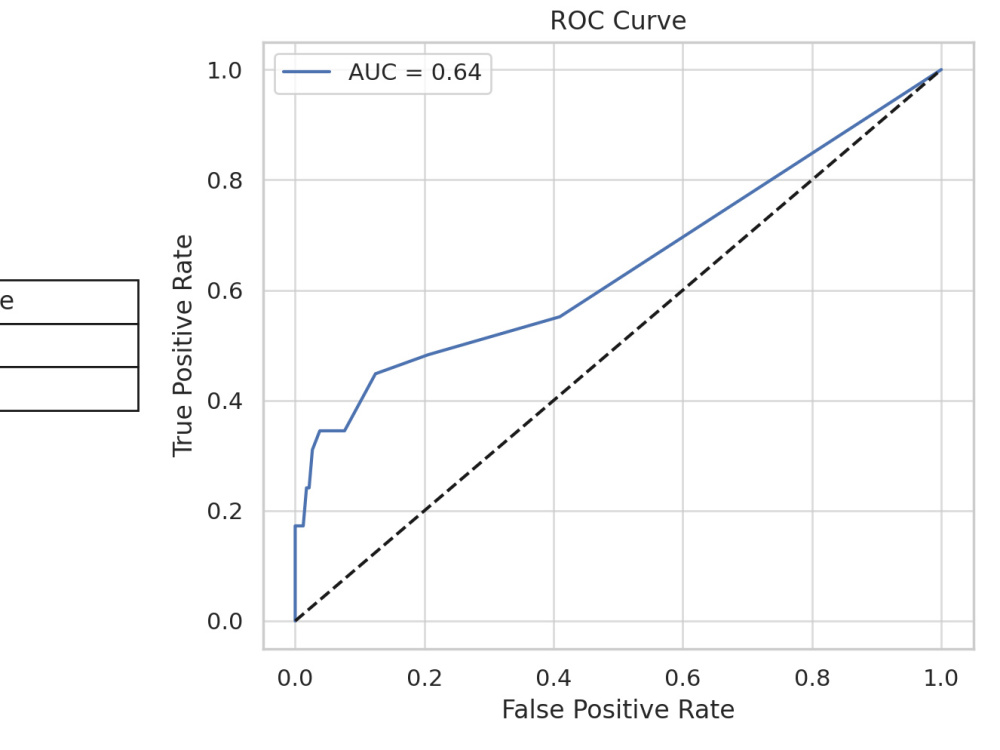
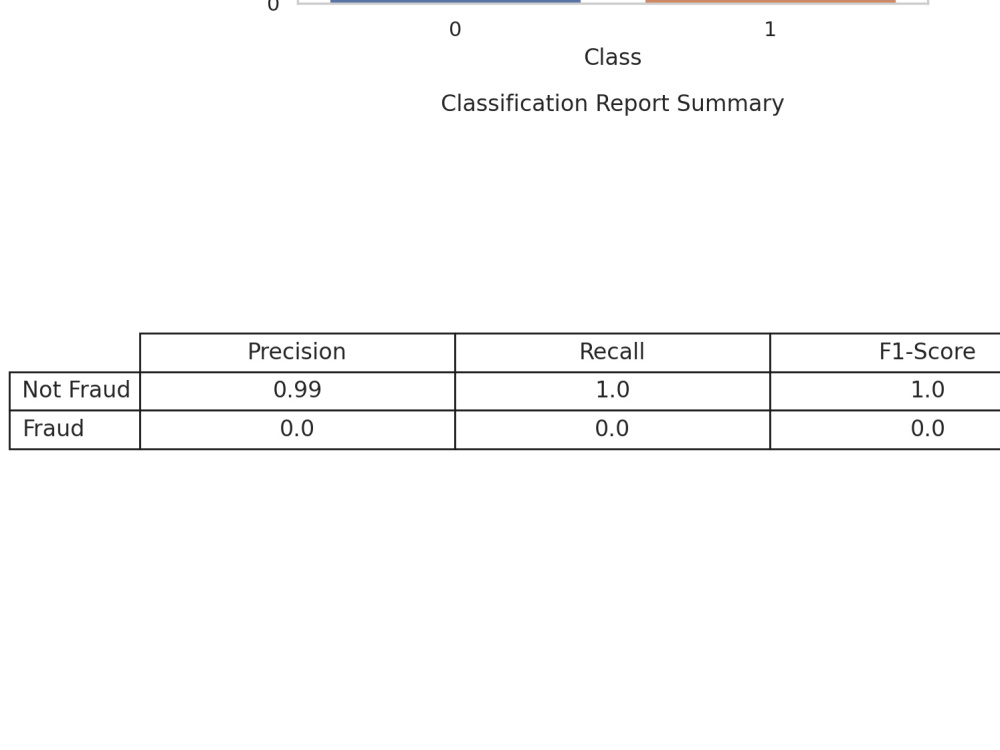
Detecting fraud isn't just about accuracy — it's about trust and precision. This project delivers an end-to-end fraud detection system using Random Forest, SMOTE for class imbalance, and SHAP for explainability. What sets it apart is not just the model, but the business-focused insights, visual dashboards, and transparent decision-making tailored to financial datasets. You’ll receive a production-ready model with visuals, performance metrics, and an optional Streamlit app for real-time testing.
Machine Learning Tools
NLTK, NumPy, pandas, Python, scikit-learn, SQL, TableauWhat's included
| Service Tiers |
Starter
$50
|
Standard
$100
|
Advanced
$150
|
|---|---|---|---|
| Delivery Time | 3 days | 5 days | 7 days |
Number of Revisions | 1 | 2 | 3 |
Number of Model Variations | 1 | 2 | 3 |
Number of Scenarios | 1 | 2 | 3 |
Number of Graphs/Charts | 2 | 4 | 8 |
Model Validation/Testing | |||
Model Documentation | - | ||
Data Source Connectivity | |||
Source Code |
Optional add-ons
You can add these on the next page.
Fast Delivery
+$25 - $60
Additional Revision
+$20
Additional Graph/Chart
(+ 1 Day)
+$10
Additional Graphs/Charts
(+ 1 Day)
+$10
Business PDF Report
(+ 2 Days)
+$25
Web Embedding / Streamlit App
(+ 3 Days)
+$40Frequently asked questions
About Eyesly Meribha
Data Scientist
Chennai, India - 11:29 am local time
Overview / Summary:
------------------------
MSc Data Science | Certified in Cybersecurity & Deep Learning | 5+ Projects Done
Hi! I’m Eyesly Meribha Johnson Paulraj, a passionate and detail-oriented Data Science professional with a strong foundation in Python, SQL, Machine Learning, and Data Visualization. With real-world experience in building data pipelines, dashboards, and machine learning models, I help businesses uncover insights and make smarter decisions.
What I Do:
-----------
Data Analysis & Dashboarding (Power BI, Tableau, Excel)
Machine Learning & Forecasting Models (Random Forest, ARIMA, ETS, XGBoost)
ETL Pipeline Development (using Airflow, Pandas, PostgreSQL)
Exploratory Data Analysis (EDA) & Data Cleaning
Reporting & KPI Dashboards for Business Stakeholders
Basic Cybersecurity & Risk Assessment Knowledge
Technical Skills:
-----------------
Languages: Python, SQL
Data Visualization: Power BI, Tableau, Matplotlib, Seaborn
Machine Learning: scikit-learn, statsmodels, XGBoost, Random Forest
Data Engineering: Pandas, Numpy, Airflow, PostgreSQL
Others: Excel, Git, Jupyter Notebook, Google Colab
My Key Projects:
-------------------
Sales Forecasting Project
→ ARIMA, ETS, Random Forest models with Power BI dashboard
→ Automated pipeline from raw data to final predictions.
Credit Card Fraud Detection
→ Trained multiple classifiers (Logistic Regression, Random Forest, XGBoost)
→ Applied PCA and SHAP for model interpretation.
Customer Sentiment Analysis (NLP)
→ Built sentiment classification pipeline using NLP & Machine Learning
→ Deployed insights with dynamic dashboard presentation.
Experience:
--------------
Freelance Data Scientist (Upwork)
→ Helping clients build predictive models and dashboards
Data Engineer – HCMS Pvt. Ltd.
Intern – UNIQ, Jarvis Software, Cloudcredits Technologies
Education:
------------
MSc Data Science – Swansea University (UK)
BSc Information Technology – Women’s Christian College, India
Certifications: Cybersecurity (Diploma), Deep Learning (OHSC)
Why Work With Me?
Professional & Friendly Communication
Clear Explanations & Clean Code
On-time Delivery with Full Documentation
Open to Long-Term Collaboration
Let’s discuss your project and make your data work smarter for you!
Click the Invite button — I’m ready to help!
Steps for completing your project
After purchasing the project, send requirements so Eyesly Meribha can start the project.
Delivery time starts when Eyesly Meribha receives requirements from you.
Eyesly Meribha works on your project following the steps below.
Revisions may occur after the delivery date.
Requirement Review & Data Validation
I will review your dataset (CSV or Excel), confirm the target column (Class), and understand your business goal — e.g., high recall or balanced performance.
Exploratory Data Analysis (EDA)
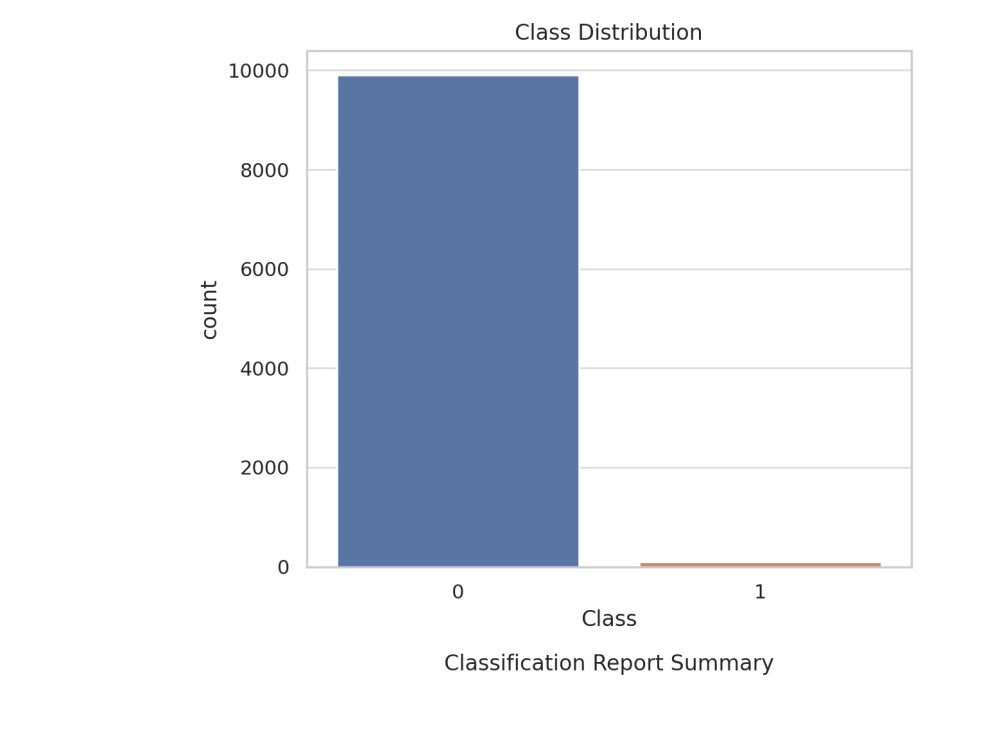
Visualize class imbalance, transaction patterns, and detect anomalies. I’ll summarize key findings before proceeding.