You will get csv, excel spreadsheet data analysis processing, visualization using python
Project details
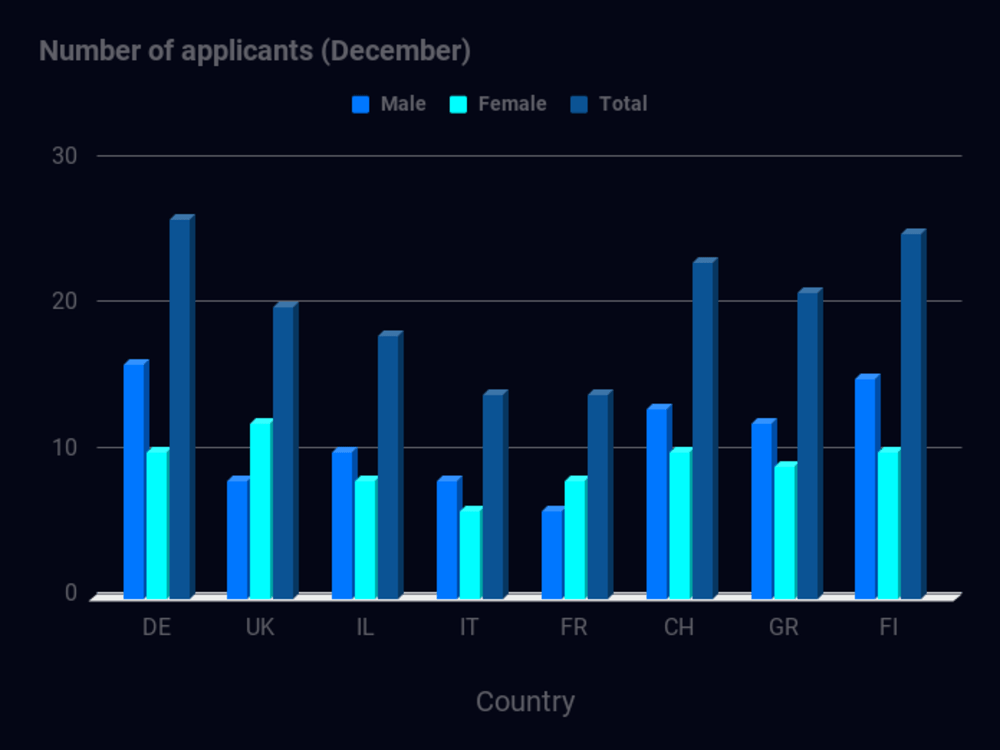
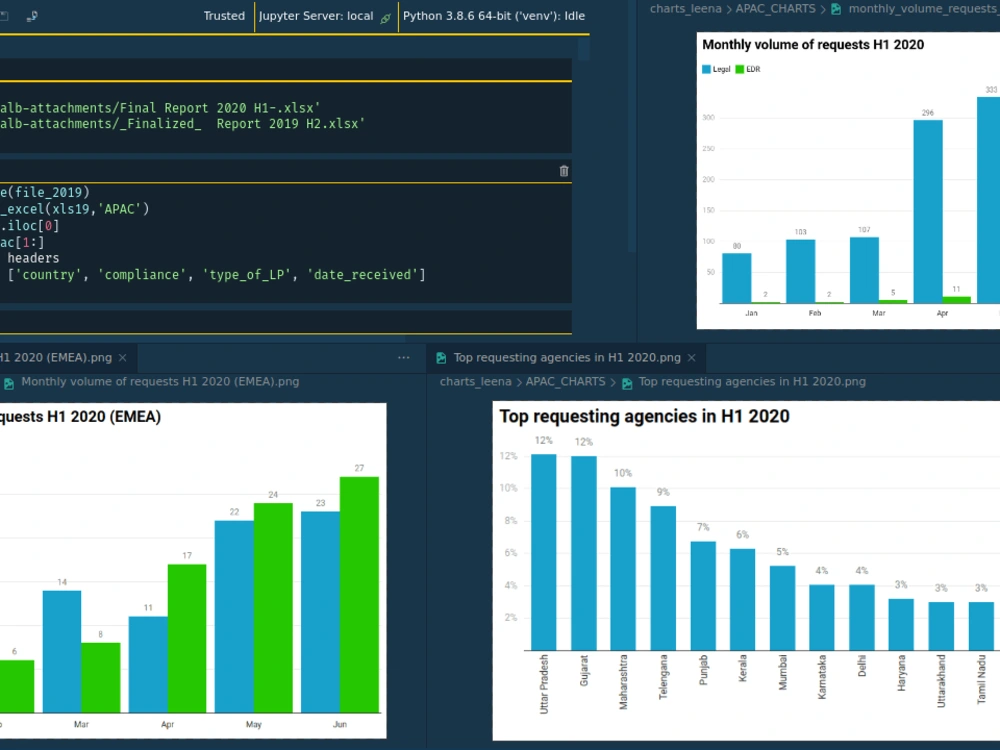
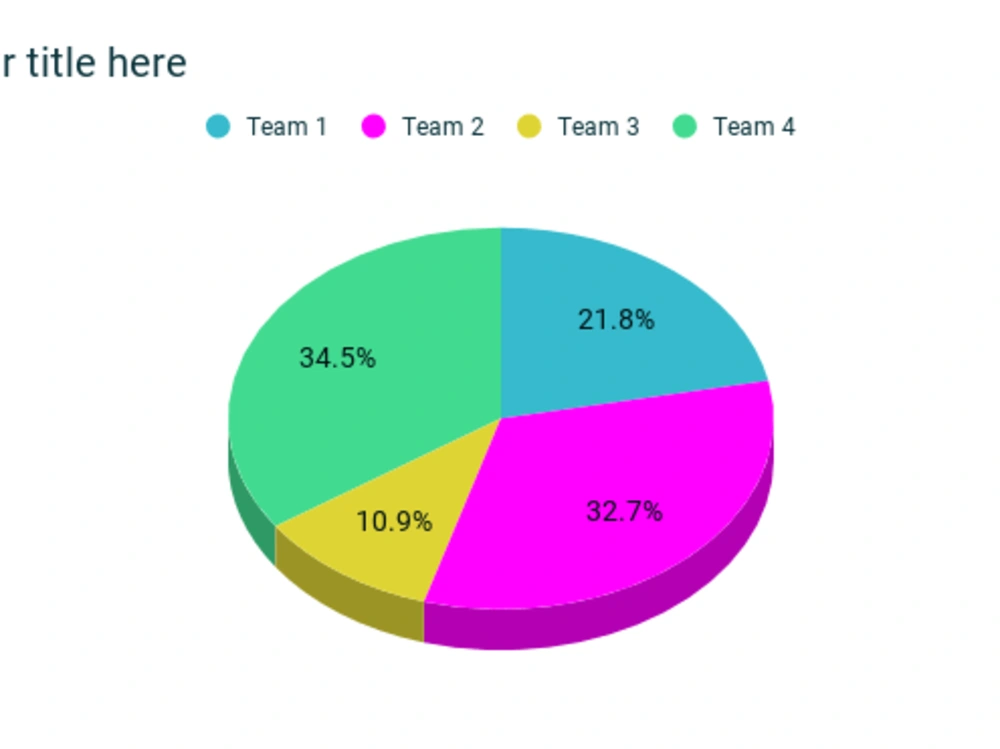
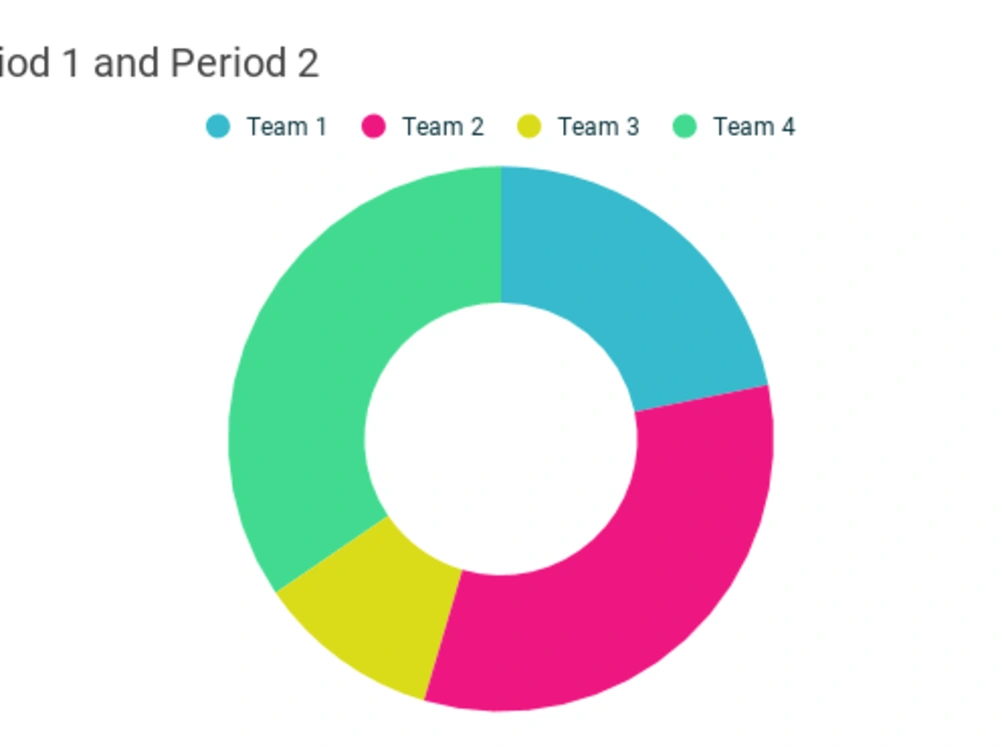
Visualizing data to represent them more clearly and summarize the meaning behind the data at a glance with beautiful, pleasing as well as informative visualization objects.
Can perform various data extraction/summarization using python and/or JavaScript and again create different visualizations using the same depending upon the nature of the task, by performing following key steps:
- Understand the data you’re trying to visualize, including its size and cardinality (the uniqueness of data values in a column).
- Determine what you’re trying to visualize and what kind of information you want to communicate.
- Know your audience and understand how it processes visual information.
- Use a visual that conveys the information in the best and simplest form for your audience.
Data source could be csv,json or any other data format.
We'll have a discussion before starting the actual work so that we can have clearing understanding of each others requirements and conditions.
Data Tool
PythonWhat's included
| Service Tiers |
Starter
$30
|
Standard
$50
|
Advanced
$80
|
|---|---|---|---|
| Delivery Time | 3 days | 5 days | 7 days |
Number of Revisions | 1 | 1 | 1 |
Number of Graphs/Charts | 1 | 3 | 5 |
Number of Variations | 1 | 3 | 5 |
Data Source Connectivity | - | - | - |
Web Embedding | |||
Interactive/Animated Visuals | - |
About Suraj
Python Data Engineer | Automation | Machine Learning and AI
Patan, Nepal - 7:22 pm local time
of software engineering.
Currently working as a full-time freelance Python Developer mainly
focused on Data Analytics, Data Science, Backend Development / Integration, Automation, and Data ETL works.
Before this, I was working as a Software Engineer for more than two years in a fintech company, primarily working as a python backend developer using Flask, which aims to provide analytics tools and solutions for historical and real-time analysis of financial markets and portfolio management.
Skills :
|| Data Science, Analytics, and Visualization
|| Machine Learning and AI
|| Quantitative Trading Algorithms Development ( Algo trading )
|| Trade Automation and Bot Development
|| Python Backend with Flask (Python, Jinja2, SQL-alchemy, PostgreSQL)
|| Data Extraction
|| Python Scripting and Automation
|| Image Processing
|| PDF Data Extraction
|| HTML/CSS/JavaScript...etc
|| Interests :
- Quantitative Trading
- Blockchain/Web3
- Financial Technology, DeFi
- Artificial Intelligence
- Machine Learning.
Let's build amazing things together.
Thank you.
Steps for completing your project
After purchasing the project, send requirements so Suraj can start the project.
Delivery time starts when Suraj receives requirements from you.
Suraj works on your project following the steps below.
Revisions may occur after the delivery date.
Initial Discussion
This is essential before starting to work on a project to know the details about the projects.