You will get Custom HTML Dashboard Connected to Excel or Google Sheets
Project details
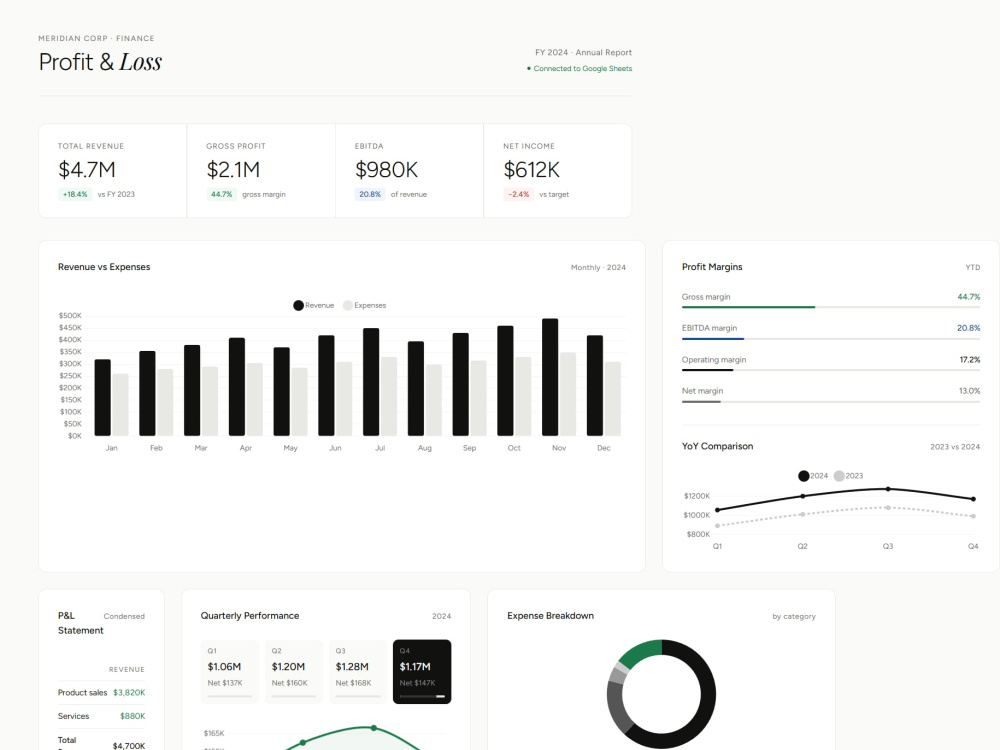
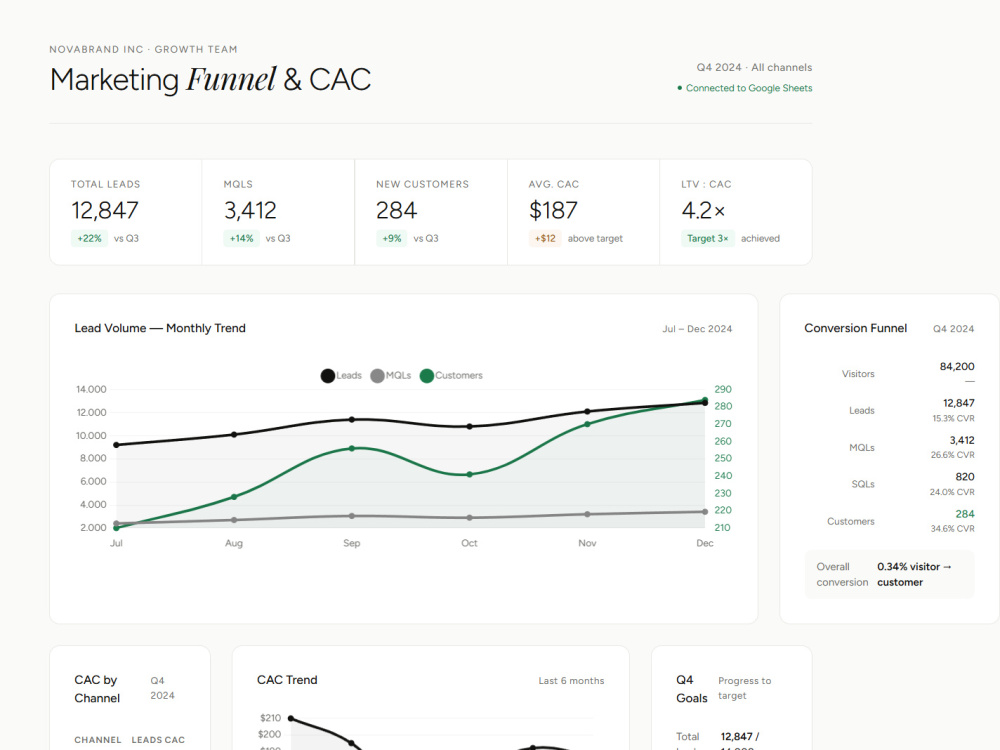
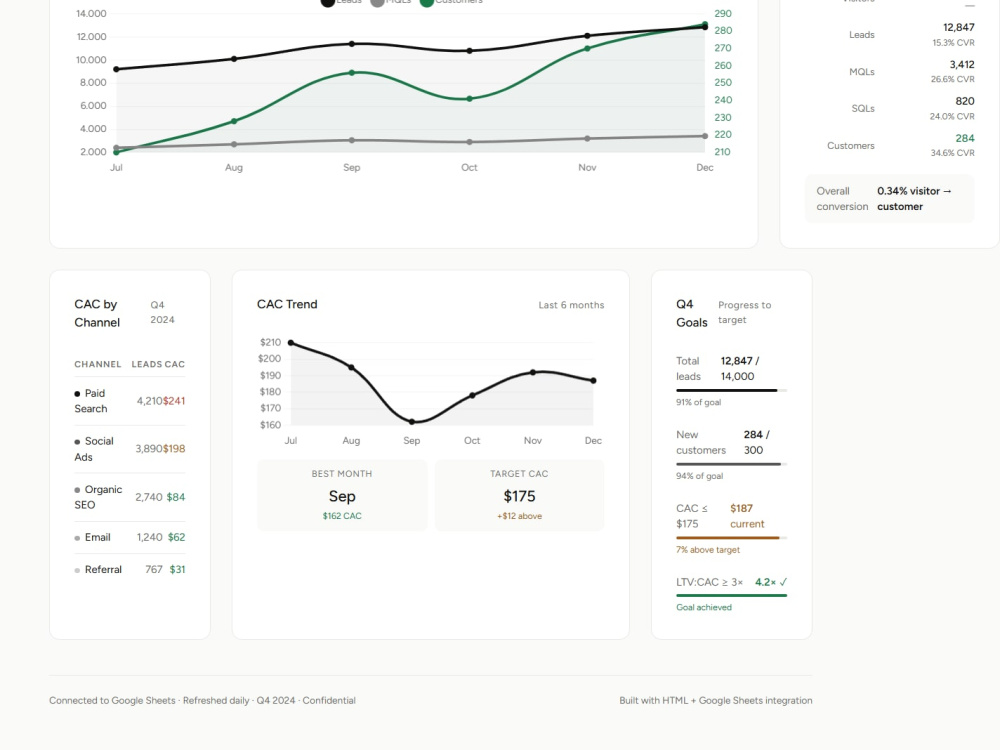
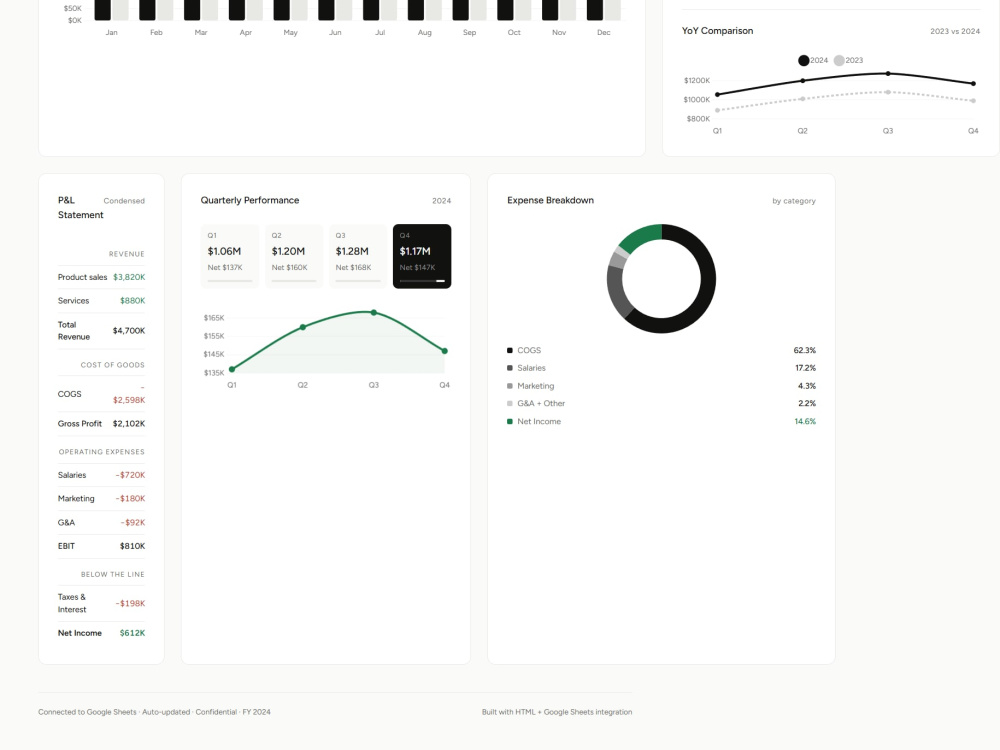
Most teams are stuck with spreadsheets that only one person understands — or paying for BI tools nobody fully uses. I build a third option: custom HTML dashboards connected directly to your Excel file or Google Sheet. Your team keeps updating the data they already know, and the dashboard updates automatically.
No Power BI license. No Tableau subscription. No complex setup. Just open the file in any browser and your data is there, clean and interactive.
What I deliver: fully interactive dashboards with charts, KPIs, and filters — responsive, branded, and ready to share or embed anywhere. Source files and documentation included so you can maintain it yourself.
My process: you share your spreadsheet, I send a layout for approval, then build and refine until you’re satisfied.
Great fit if you already have data in Excel or Google Sheets and want a professional dashboard without buying software licenses. Not sure which package fits? Send me a message — I respond within 24 hours.
Programming Languages
HTML & CSS, JavaCoding Expertise
Cross Browser & Device CompatibilityWhat's included
| Service Tiers |
Starter
$50
|
Standard
$150
|
Advanced
$650
|
|---|---|---|---|
| Delivery Time | 3 days | 5 days | 10 days |
Number of Revisions | 1 | 3 | Unlimited |
Number of Pages | 1 | 3 | |
Design Customization | - | ||
Content Upload | |||
Responsive Design | |||
Source Code | - | - |
Optional add-ons
You can add these on the next page.
Additional Revision
+$20
Design Customization
(+ 2 Days)
+$20
Source Code
+$30About Sewzeh
- Python Developer Process Automation & Power BI
Jundiai, Brazil - 5:23 pm local time
🔹 What I do best:
- Automating repetitive business processes with Python
- Building ETL pipelines for data cleaning and transformation
- Managing and mining data to ensure accuracy and consistency
- Designing interactive dashboards in Power BI to deliver actionable insights
- Integrating data from multiple sources (SQL, APIs, spreadsheets)
🔹 Experience:
I have hands-on experience developing automation scripts, creating data workflows, and building dashboards that empower teams to track KPIs and optimize performance. My projects include Python-based solutions for reporting automation and Power BI dashboards for business monitoring.
🔹 Interests:
I am passionate about turning raw data into meaningful stories. I enjoy solving complex problems, streamlining workflows, and helping businesses unlock the full potential of their data.
Steps for completing your project
After purchasing the project, send requirements so Sewzeh can start the project.
Delivery time starts when Sewzeh receives requirements from you.
Sewzeh works on your project following the steps below.
Revisions may occur after the delivery date.
Data & Scope Review
I analyze your spreadsheet, confirm the KPIs and layout scope, and send you a wireframe for approval before any code is written.
Dashboard Build
I build the full HTML dashboard connected to your data, following the approved layout and your brand style.