You will get Dashboard (Excel / Flask)
Project details
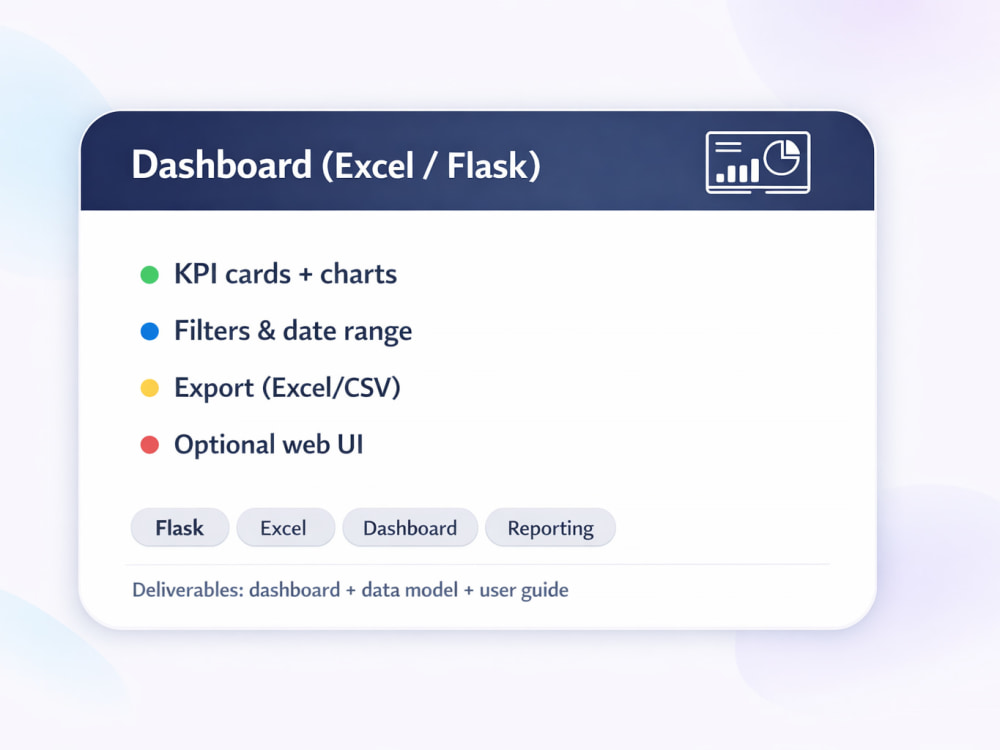
I will build a KPI dashboard in Excel or Flask to monitor your key metrics in one place.
You’ll get KPI cards, charts, filters (including date range), and an export-ready view (Excel/CSV optional).
The dashboard is designed to be clear, fast to use, and easy to update with new data.
You’ll get KPI cards, charts, filters (including date range), and an export-ready view (Excel/CSV optional).
The dashboard is designed to be clear, fast to use, and easy to update with new data.
Programming Languages
HTML & CSS, JavaScript, PythonCoding Expertise
Cross Browser & Device CompatibilityWhat's included
| Service Tiers |
Starter
$150
|
Standard
$250
|
Advanced
$499
|
|---|---|---|---|
| Delivery Time | 4 days | 6 days | 9 days |
Number of Revisions | 1 | 2 | 2 |
Number of Pages | 1 | 2 | 3 |
Design Customization | - | ||
Content Upload | - | - | |
Responsive Design | - | - | |
Source Code |
Optional add-ons
You can add these on the next page.
Fast Delivery
+$75 - $250
Additional Revision
+$25
Content Upload
(+ 1 Day)
+$75Frequently asked questions
About Anatoli
Python + Excel Automation | Flask Dashboards | Reporting, Data Cleanup
Iasi, Romania - 3:33 pm local time
I can also wrap the workflow into a simple Flask dashboard (upload file → get cleaned data/report).
What I deliver fast:
• Merge multiple Excel/CSV files into one clean dataset (even 10–20 files)
• Data cleaning: duplicates, formats, validation rules, missing values
• Reconciliation (List A vs List B): mismatches + exceptions report
• KPI reports in Excel (pivot-ready tables + charts)
You get: the final Excel report + Python script (and/or VBA) + short instructions to refresh it on new data.
Steps for completing your project
After purchasing the project, send requirements so Anatoli can start the project.
Delivery time starts when Anatoli receives requirements from you.
Anatoli works on your project following the steps below.
Revisions may occur after the delivery date.
Define KPIs & layout
Confirm KPIs, filters, and the dashboard layout based on your sample data.
build Dashboard
Create KPI cards, charts, filters, and the data model behind them.