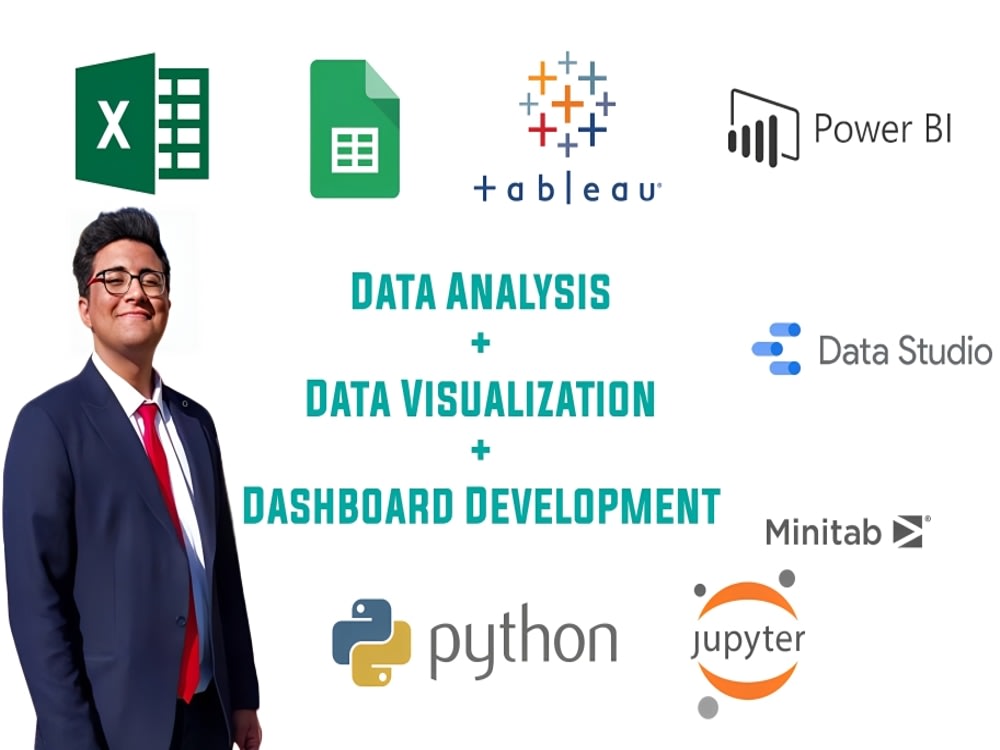
You will get Data Analysis & Visualization Using Tableau , Power BI , Python, SQL, R

Project details
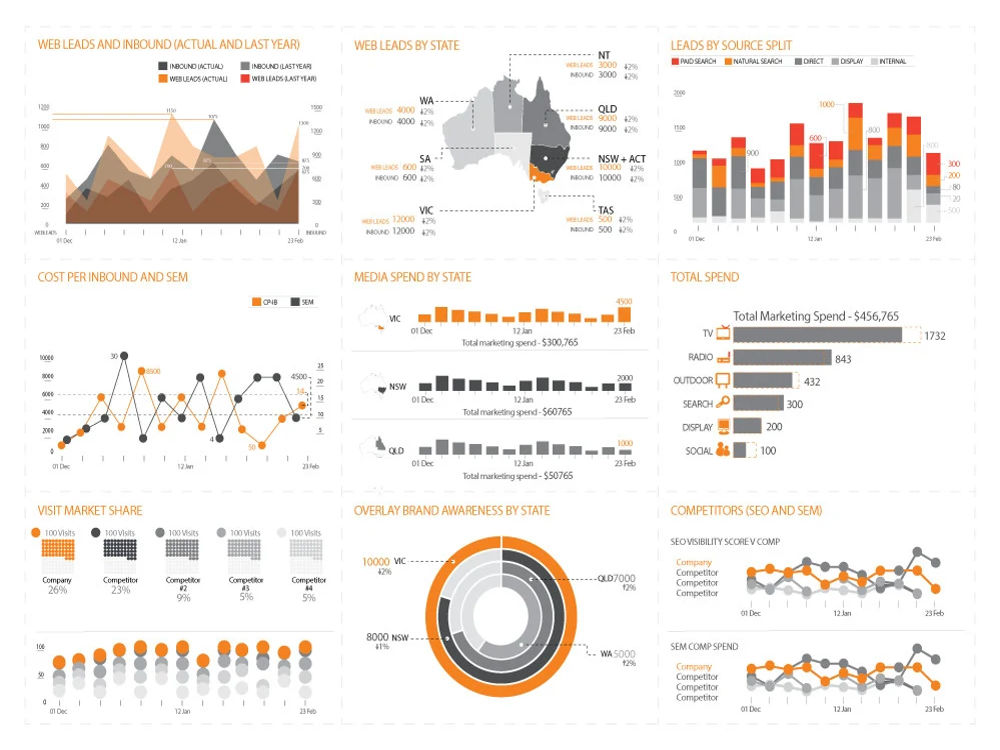
1. **Tableau Expertise:** I have extensive knowledge and experience in working with Tableau, allowing me to unleash its full potential for data analysis and visualization.
2. **Data Cleaning and Preparation:** I specialize in ensuring data quality by employing various techniques and tools to clean and prepare data for analysis.
3. **Strong Analytical Skills:** I possess the ability to derive meaningful insights from complex datasets, enabling me to uncover valuable patterns and correlations.
4. **Meticulous Attention to Detail:** I pay close attention to detail throughout the project, ensuring accuracy and reliability in each step.
5. **Effective Communication:** I excel at presenting insights in a clear, concise, and easy-to-understand manner to stakeholders.
6. **Creativity and Innovation:** I bring a creative and innovative approach to my projects, utilizing different design elements, interactive features, and storytelling techniques to make dashboards engaging and impactful.
Data Tool
TableauWhat's included
| Service Tiers |
Starter
$5
|
Standard
$10
|
Advanced
$15
|
|---|---|---|---|
| Delivery Time | 1 day | 1 day | 1 day |
Number of Revisions | Unlimited | Unlimited | Unlimited |
Number of Graphs/Charts | 7 | 7 | 7 |
Data Source Connectivity | |||
Web Embedding | |||
Interactive/Animated Visuals |
About John
Data Analyst / Business Intelligence Specialist
6th of October City, Egypt - 10:13 am local time
1. Data Analysis: I possess strong skills in extracting, transforming, and analyzing data using Python, SQL, and R. Whether it involves cleaning and preparing data, performing statistical analysis, or implementing machine learning algorithms, I am proficient in leveraging these programming languages to derive meaningful insights from complex datasets.
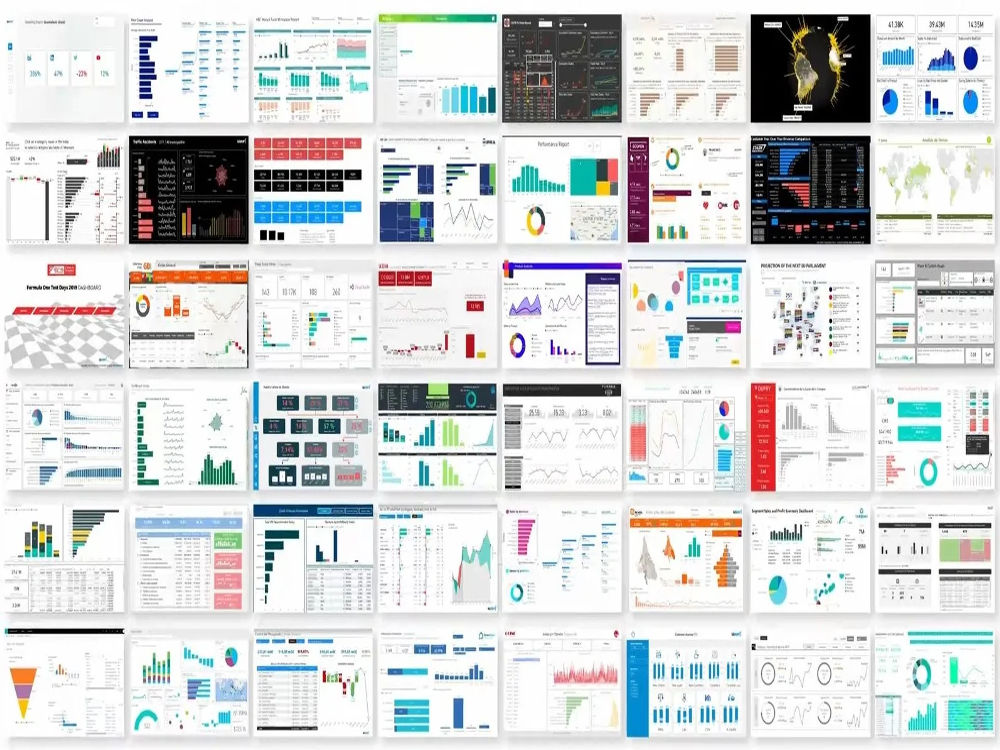
2. Data Visualization: I have a knack for creating compelling visual representations of data using tools like Power BI, Tableau, and Minitab. I excel in designing intuitive and interactive dashboards, charts, and graphs that effectively communicate key findings and trends to stakeholders.
3. Report Generation: With my extensive experience in data analysis, I am adept at generating comprehensive reports and presentations. I specialize in crafting custom PowerPoint presentations that effectively convey complex information in a visually appealing and easily digestible manner.
4. Problem Solving: As a data analyst, I thrive in tackling complex problems and providing data-driven solutions. I possess strong analytical and critical thinking skills, enabling me to identify patterns, uncover insights, and make informed decisions based on data analysis.
5. Client Collaboration: Throughout my career, I have worked closely with clients from various industries, understanding their unique requirements and delivering tailored data analysis solutions. I am skilled at translating business objectives into actionable data strategies and collaborating with stakeholders to ensure the successful implementation of analytical projects.
6. Continuous Learning: In the rapidly evolving field of data analysis, I am committed to staying up-to-date with the latest tools, techniques, and trends. I continuously expand my skill set to incorporate emerging technologies and methodologies, enabling me to provide cutting-edge solutions to my clients.
My expertise lies in data analysis, data visualization, report generation, problem solving, client collaboration, and continuous learning. With my proficiency in Python, SQL, R, Power BI, Tableau, Minitab, and creating custom PowerPoints, I am well-equipped to assist clients in extracting insights from their data and making data-driven decisions.
Steps for completing your project
After purchasing the project, send requirements so John can start the project.
Delivery time starts when John receives requirements from you.
John works on your project following the steps below.
Revisions may occur after the delivery date.
Clean and Pre Process Data
Will go over your data cleaning it from errors or null Values and inconsistencies Before inputting into my visualization software
Analysis and Graphing
Will Analyze your data and explore it then i will start creating relevant and important Graphs