You will get data cleaning & visualization in Excel or Google Sheets
Rising Talent
Rising Talent
Project details
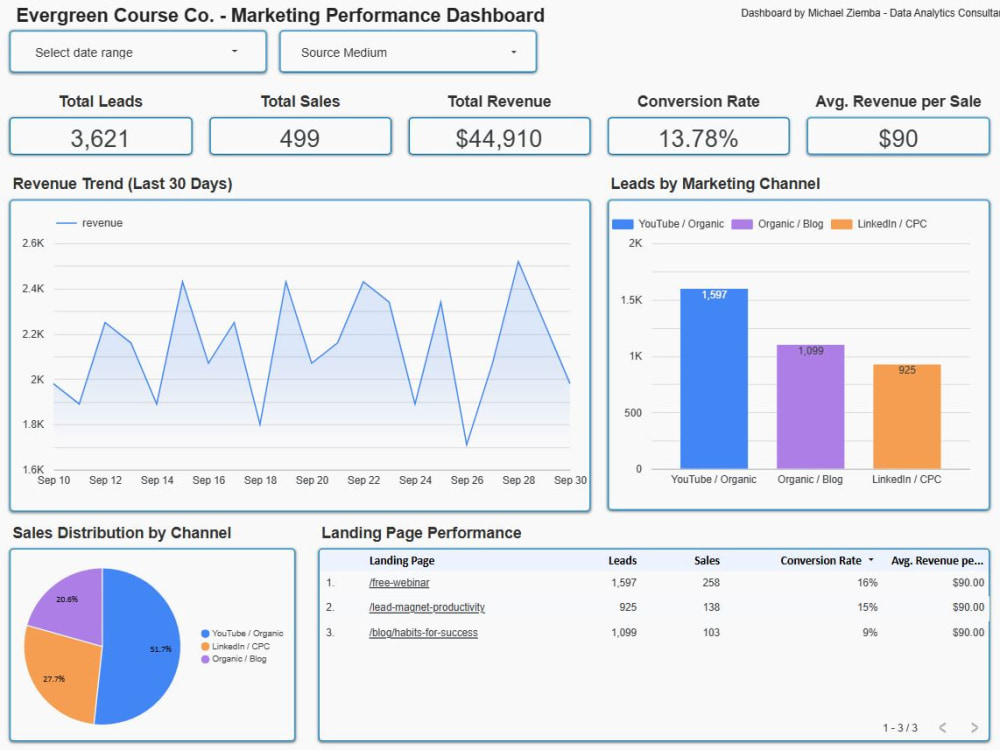
Need help turning messy data into clear, actionable insights?
I specialize in transforming raw spreadsheets into structured, easy-to-understand reports and dashboards using Excel or Google Sheets. Whether it's cleaning data, creating charts, or uncovering trends, I'll help you present your information clearly and profesionally:
What you'll get:
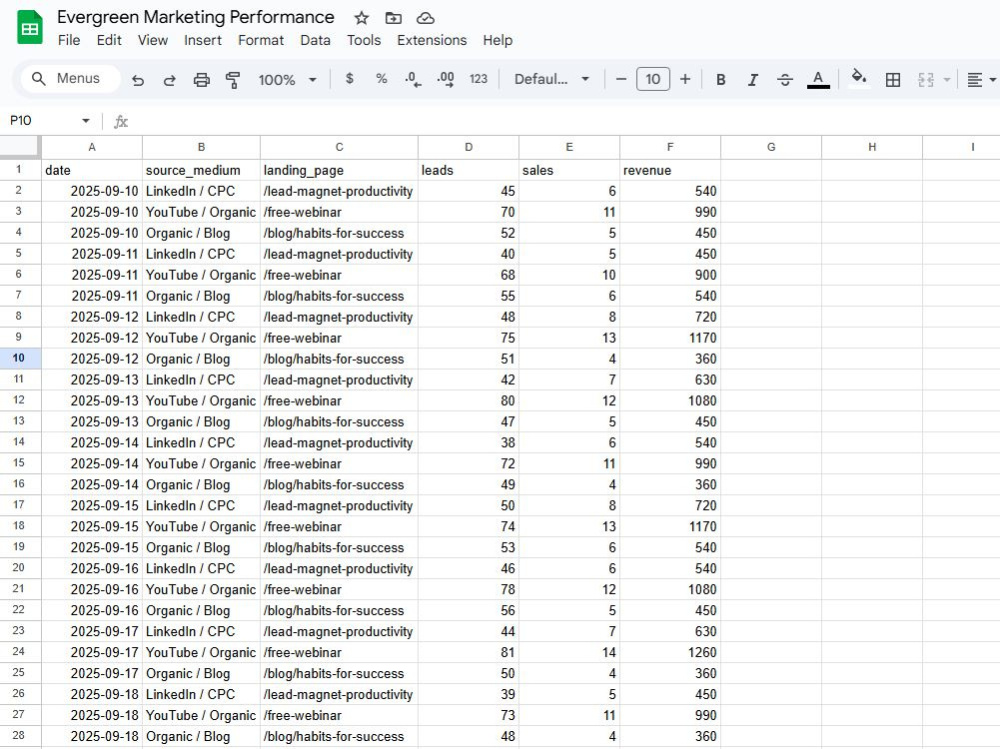
• Cleaned, structured data ready for analysis
• Visual reports and charts customized for your business goals
• Summary of key findings and trends
Why work with me:
• 10+ years of experience in data analytics and reporting
• Fast, reliable communication and quick turnaround
• Data handled securely and confidentially
Need to analyze more than 100,000 rows or integrate multiple files?
No problem - I can quote a custom price for large datasets or complex automation workflows.
I can deliver accurate results fast, with visual polish that makes your data presentation-ready. Let's make your numbers make sense.
I specialize in transforming raw spreadsheets into structured, easy-to-understand reports and dashboards using Excel or Google Sheets. Whether it's cleaning data, creating charts, or uncovering trends, I'll help you present your information clearly and profesionally:
What you'll get:
• Cleaned, structured data ready for analysis
• Visual reports and charts customized for your business goals
• Summary of key findings and trends
Why work with me:
• 10+ years of experience in data analytics and reporting
• Fast, reliable communication and quick turnaround
• Data handled securely and confidentially
Need to analyze more than 100,000 rows or integrate multiple files?
No problem - I can quote a custom price for large datasets or complex automation workflows.
I can deliver accurate results fast, with visual polish that makes your data presentation-ready. Let's make your numbers make sense.
Data Tool
Google SheetsWhat's included
| Service Tiers |
Starter
$75
|
Standard
$150
|
Advanced
$250
|
|---|---|---|---|
| Delivery Time | 2 days | 3 days | 5 days |
Number of Revisions | 1 | 2 | 3 |
Optional add-ons
You can add these on the next page.
Fast Delivery
+$40
Additional Revision
+$25
Combine Multiple Fields
+$50
Extended Insights Report (Custom Add-On)
(+ 1 Day)
+$40Frequently asked questions
About Michael
Data Systems Builder | Reconciliation, Spend Analysis, and Audit-Ready
Munroe Falls, United States - 6:24 pm local time
I build clean, reliable data systems that help businesses understand where their money, inventory, and operations actually stand.
My work has identified $100K–$500K+ in hidden waste, reconciled broken financial reports, and replaced fragile spreadsheets with structured, repeatable systems.
What I Do
I specialize in solving messy, high-impact data problems across finance and operations, including:
• Financial data reconciliation (transactions, GL, reporting discrepancies)
• Inventory analysis & discrepancy detection across systems (store, warehouse, 3PL)
• Spend analysis (P-cards, vendors, anomaly detection, policy compliance)
• Excel system builds (not just spreadsheets but structured, scalable tools)
• SQL-based data extraction and reporting
• Dashboard development (Power BI, Qlik, Tableau, SAP Analytics Cloud)
What Makes My Work Different
Most analysts stop at “here’s the data.”
I go further:
• I make sure the numbers tie out to the source system
• I document transformations so results are repeatable and auditable
• I design outputs that are actually usable for decision-making
This is especially important for:
Finance teams
Operations teams
Audit / compliance environments
Selected Project Experience
• Identified ~$600K in unnecessary telecom spend by analyzing 8,500+ devices, leading to immediate cost reduction actions
• Reconciled discrepancies between financial reporting outputs and SAP data (GLT0, BSEG), correcting multi-million dollar misinterpretations
• Built a full P-card analytics system (2017–2025) to detect anomalies, vendor patterns, and high-risk spending behavior
• Developed structured Excel-based systems for tracking, reporting, and operational decision-making
Tools & Platforms
Data & Analysis:
Excel (Advanced), SQL, Python (Pandas), Alteryx
BI & Visualization:
Qlik Sense, Power BI, Tableau, SAP Analytics Cloud
Systems & Data Sources:
SAP (ECC, S/4HANA), Concur, financial and operational systems
How I Work
I focus on clarity, speed, and trust:
• I ask the right questions upfront to avoid rework
• I communicate clearly and keep things moving
• I build solutions that you can actually maintain after handoff
If you’re dealing with messy data, inconsistent reporting, or systems that don’t quite add up - I’d be happy to help.
Steps for completing your project
After purchasing the project, send requirements so Michael can start the project.
Delivery time starts when Michael receives requirements from you.
Michael works on your project following the steps below.
Revisions may occur after the delivery date.
Review & Clarify
Review the dataset and confirm your objectives.
Clean & organize
Remove duplicates, fix formatting issues, and prepare structured data for analysis.