You will get Data & Dashboard Specialist | eCommerce, Finance & BI Solutions
Project details
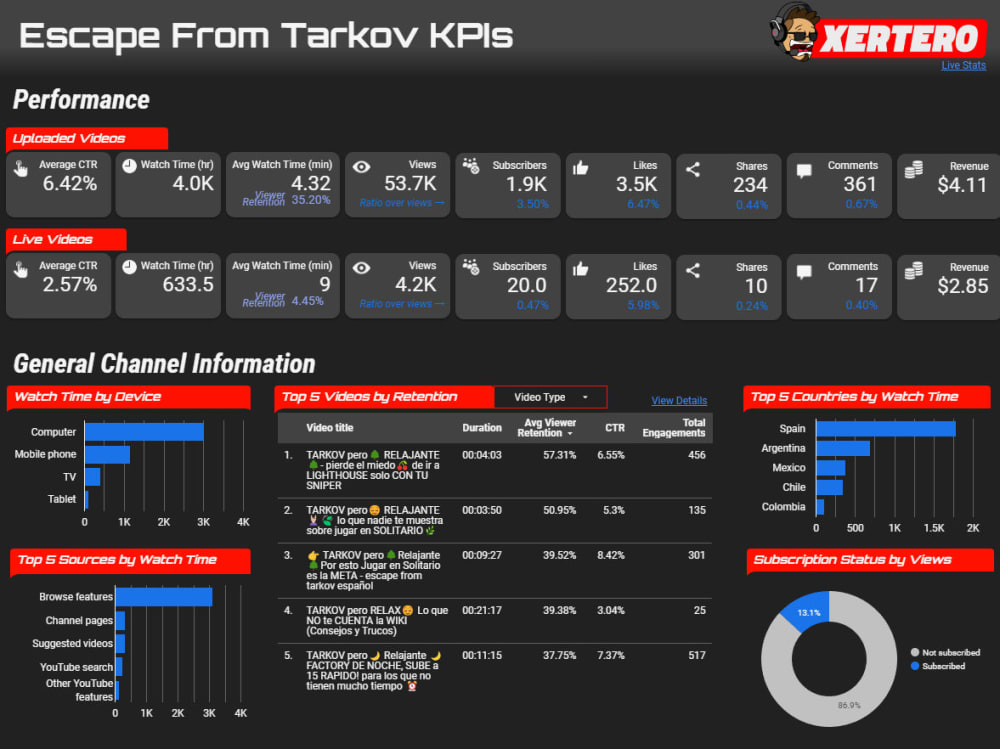
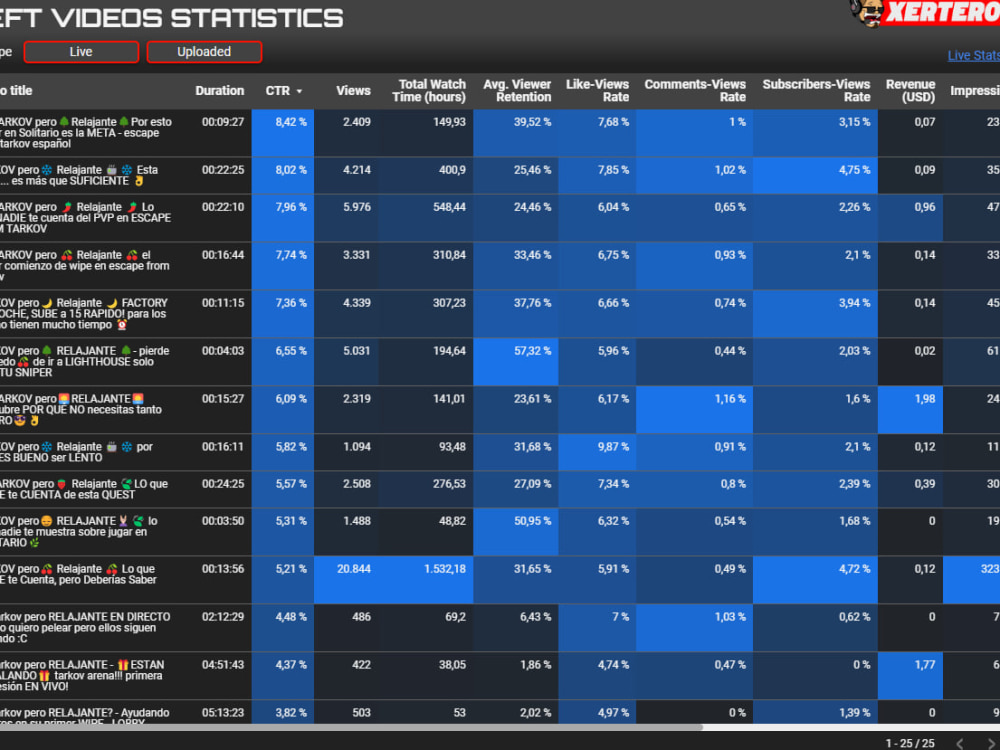
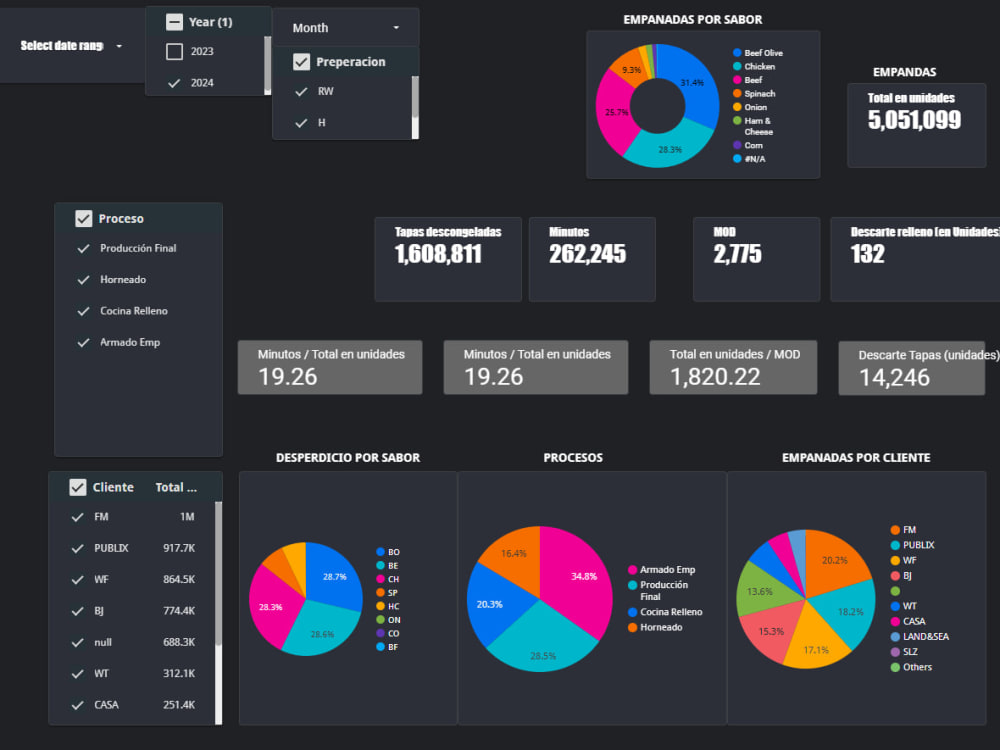
I am an experienced financial analyst with a passion for data visualization and business intelligence. With a strong background in finance, I have developed numerous dynamic and insightful dashboards that help organizations analyze data, track KPIs, and make well-informed decisions. I specialize in using tools like Looker Studio, Power BI, and Tableau to create customized, easy-to-understand visual reports that enable businesses to gain actionable insights from complex datasets.
Whether you're looking to visualize sales performance, financial trends, inventory data, or any other critical business metric, I offer tailored solutions that meet your needs. My expertise also includes connecting various data sources, automating reporting processes, and creating interactive, user-friendly dashboards that allow stakeholders to access real-time data at their convenience. With my attention to detail and strong analytical skills, I ensure that each dashboard is not only visually appealing but also delivers precise and reliable data to drive business success.
Whether you're looking to visualize sales performance, financial trends, inventory data, or any other critical business metric, I offer tailored solutions that meet your needs. My expertise also includes connecting various data sources, automating reporting processes, and creating interactive, user-friendly dashboards that allow stakeholders to access real-time data at their convenience. With my attention to detail and strong analytical skills, I ensure that each dashboard is not only visually appealing but also delivers precise and reliable data to drive business success.
Data Tool
Google Data StudioWhat's included
| Service Tiers |
Starter
$50
|
Standard
$120
|
Advanced
$250
|
|---|---|---|---|
| Delivery Time | 2 days | 4 days | 7 days |
Number of Revisions | 1 | 2 | 3 |
Number of Graphs/Charts | 4 | 8 | 20 |
Number of Variations | 2 | 4 | 5 |
Data Source Connectivity | |||
Web Embedding | |||
Interactive/Animated Visuals |
Frequently asked questions
About Yesenia
Business Analyst | Finance & Marketing | Dashboards & Automation |KPIs
Malaga, Spain - 4:52 am local time
📊 Expert in Data & Dashboards
I create clear, interactive dashboards that transform raw data into structured reports, making it easier to track key metrics and drive strategic decisions.
🔍 Precision & Accuracy
With a background in audit, I take data integrity seriously, ensuring every metric is validated before being used to inform critical decisions.
🤝 Stakeholder-Centered Approach
I collaborate closely with clients to build dashboards tailored to their needs, prioritizing relevant KPIs, whether in finance or digital marketing. I welcome follow-up discussions to refine insights and improve reporting structures.
🌎 Bilingual & Global Experience
Fluent in English & Spanish, I have worked with international teams from PwC, Accenture, and Volkswagen, ensuring seamless communication across different business environments.
🚀 Let’s bring clarity to your data! Check out my portfolio and feel free to reach out.
Steps for completing your project
After purchasing the project, send requirements so Yesenia can start the project.
Delivery time starts when Yesenia receives requirements from you.
Yesenia works on your project following the steps below.
Revisions may occur after the delivery date.
Initial Consultation
Review the project requirements and confirm all the details (data sources, metrics to track, specific KPIs, etc.) Discuss preferred tools (Looker Studio, Power BI, Tableau) and any particular design preferences.
Data Collection & Setup
Gather all necessary data from the provided sources (spreadsheets, databases, etc.). Verify the data’s accuracy and ensure it’s ready for visualization.