You will get A neat GIS Mapping Project created using ArcGIS, QGIS and Illustrator
Project details
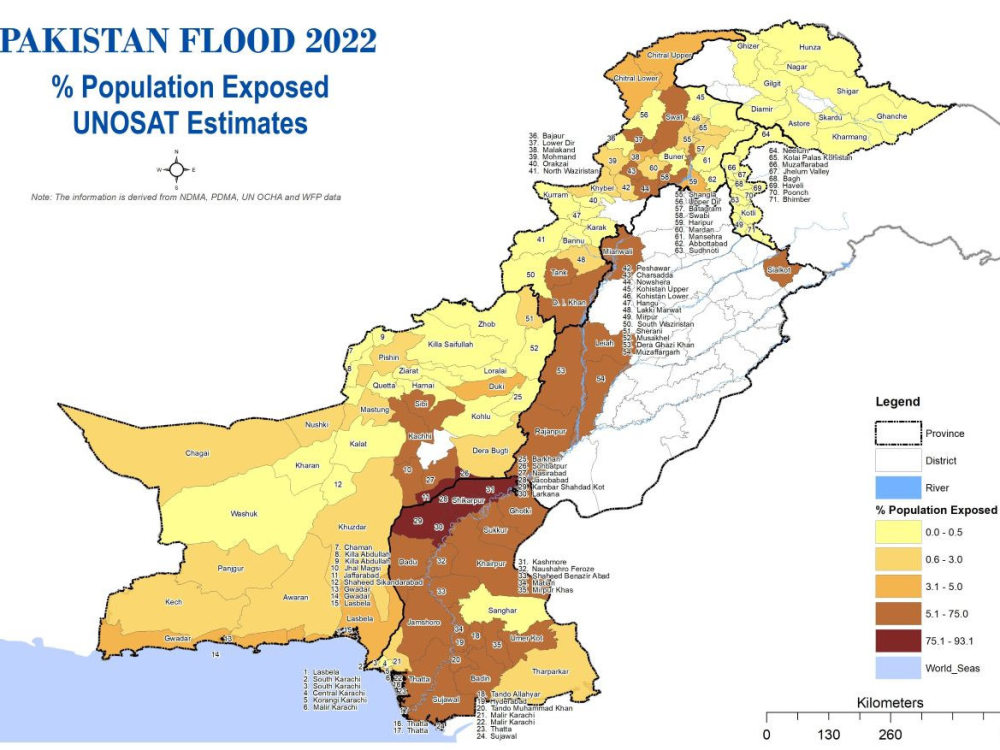
Heat Map Analysis of Flood Damages
In this project, I developed district-level heat maps to visualize the spatial distribution of damages caused by flooding. Using geospatial analysis techniques, I aggregated field and secondary data on infrastructure and community losses, and applied spatial weighting to create intensity-based heat maps.
The maps provided a visual representation of damage severity, enabling stakeholders to quickly identify hotspots and priority areas for relief and rehabilitation. This approach significantly improved decision-making efficiency, as it transformed complex datasets into intuitive visuals that supported disaster response planning, resource allocation, and risk assessment.
Data Tool
ArcGISWhat's included $25
These options are included with the project scope.
$25
- Delivery Time 1 day
- Number of Revisions 0
- Number of Graphs/Charts 1
1 review
(1)
(0)
(0)
(0)
(0)
This project doesn't have any reviews.
AM
Alexey M.
Mar 10, 2011
Data Entry, GIS, map making
About sheraz
GIS & Remote Sensing Specialist | Research & Technical Writing Expert
Islamabad, Pakistan - 3:20 pm local time
Pillar 1 – GIS & Spatial Intelligence (core strength)
Spatial Data Infrastructure & Geodatabases – design, integration, and management of multi-source datasets (vector, raster, tabular, real-time feeds)
Spatial Analysis & Modeling – overlay, network, proximity, multi-criteria, and risk mapping
Land & Urban Systems – cadastral mapping, 3D land administration, urban growth modeling, and zoning analysis
Flood & Hazard Assessment (GIS-led) – hydrological modeling, watershed delineation, flood inundation mapping
Visualization & Decision Support – dashboards, web GIS portals, thematic atlases
Tools: ArcGIS Pro, QGIS, PostgreSQL/PostGIS, Python (geopandas, shapely, rasterio), Leaflet/Mapbox, Power BI
Pillar 2 – Remote Sensing & Image Processing (support strength)
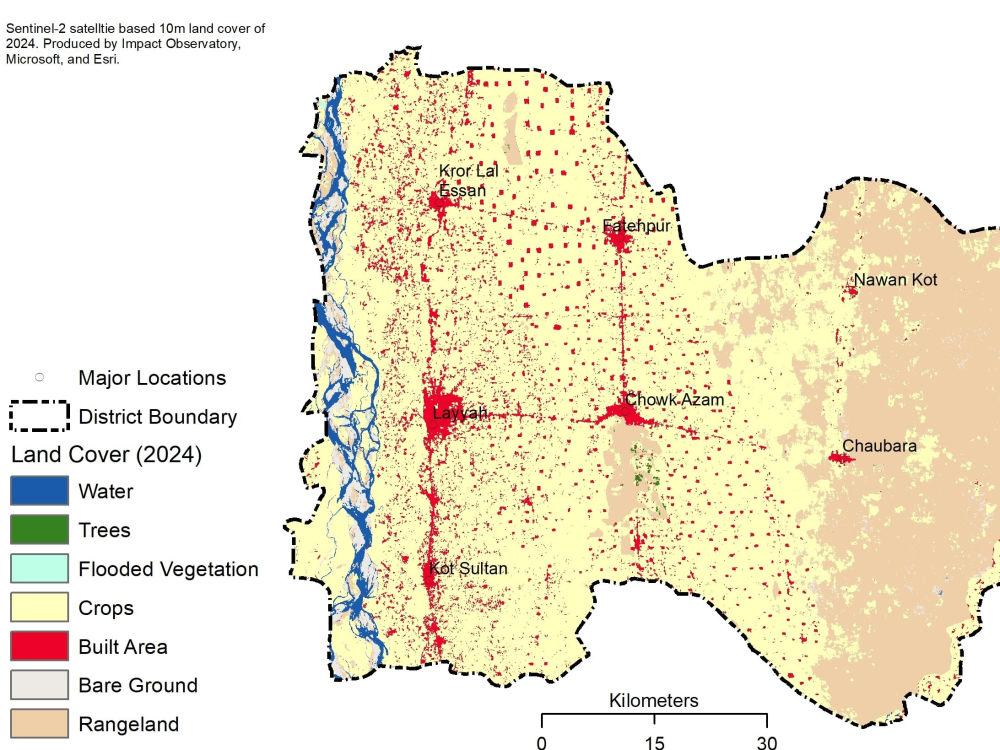
Rapid Geospatial Assessments – floods, droughts, wildfires, crop health, and climate impacts
Economic & Social Insights – night-time lights (VIIRS/DMSP) for economic activity & resilience
Environmental & LULC Monitoring – land cover classification, change detection, ecosystem mapping
Machine Learning & AI – Random Forest, CNNs, and GEE for predictive modeling
Topographic & Terrain Analysis – DEM/DSM derivatives, flood depth & elevation extraction
Tools: Google Earth Engine, Python (scikit-learn, TensorFlow), UAV imagery, ENVI/ERDAS
Research & Technical Writing (cross-cutting)
Academic papers, donor-funded project reports, and policy briefs
Manuscript editing, formatting (APA, IEEE, journal-specific), citation management
Integration of geospatial outputs (maps, models, dashboards) into research deliverables
End-to-end support: from data analysis to publication-ready outputs
Tools:EndNote, MS Office, Scopus, WoS, Google Scholar,
What Sets Me Apart
I bring versatility across the geospatial spectrum — from GIS-based modeling and infrastructure development to remote sensing analytics and academic writing. Whether it’s building a national SDI, conducting a rapid disaster assessment, or delivering a peer-reviewed journal paper, I ensure outputs that are technically robust, decision-oriented, and publication-ready.
Steps for completing your project
After purchasing the project, send requirements so sheraz can start the project.
Delivery time starts when sheraz receives requirements from you.
sheraz works on your project following the steps below.
Revisions may occur after the delivery date.
Project area description and requirements
Data collection and analysis