You will get Data visualization using Python, Looker, Tableau and Power BI
Project details
I am a data visualization specialist with extensive experience in creating interactive, informative, and visually appealing visualizations using Python. I have a strong background in data visualization and programming, and I can work with a variety of data sources to extract insights and communicate them effectively.
My expertise includes:
Data cleaning and preparation for visualization
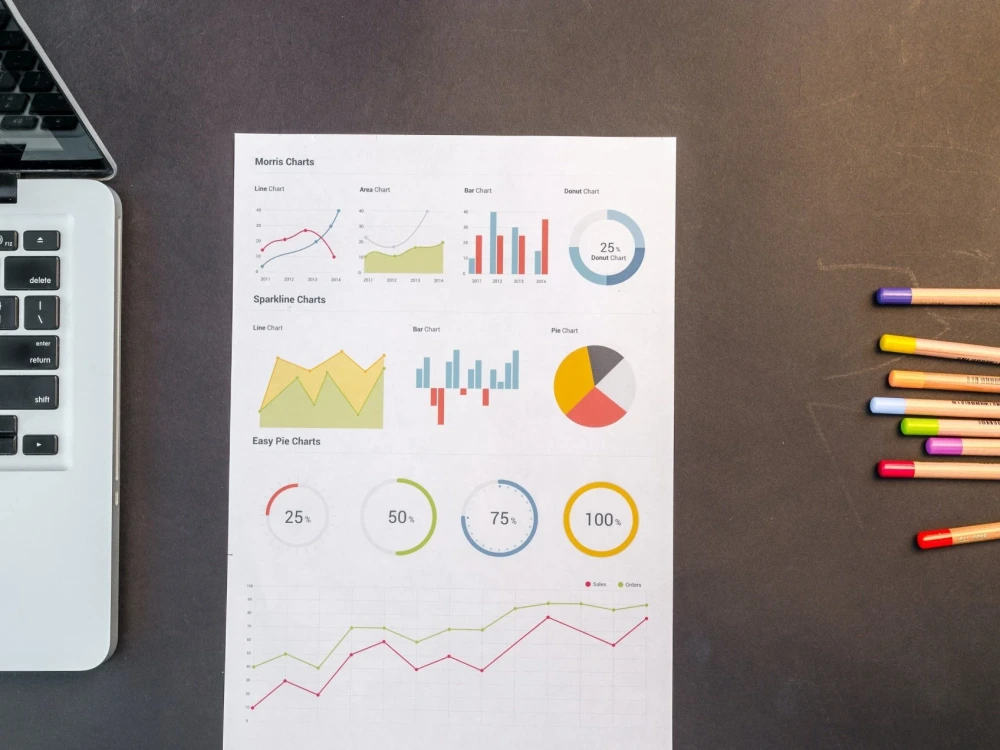
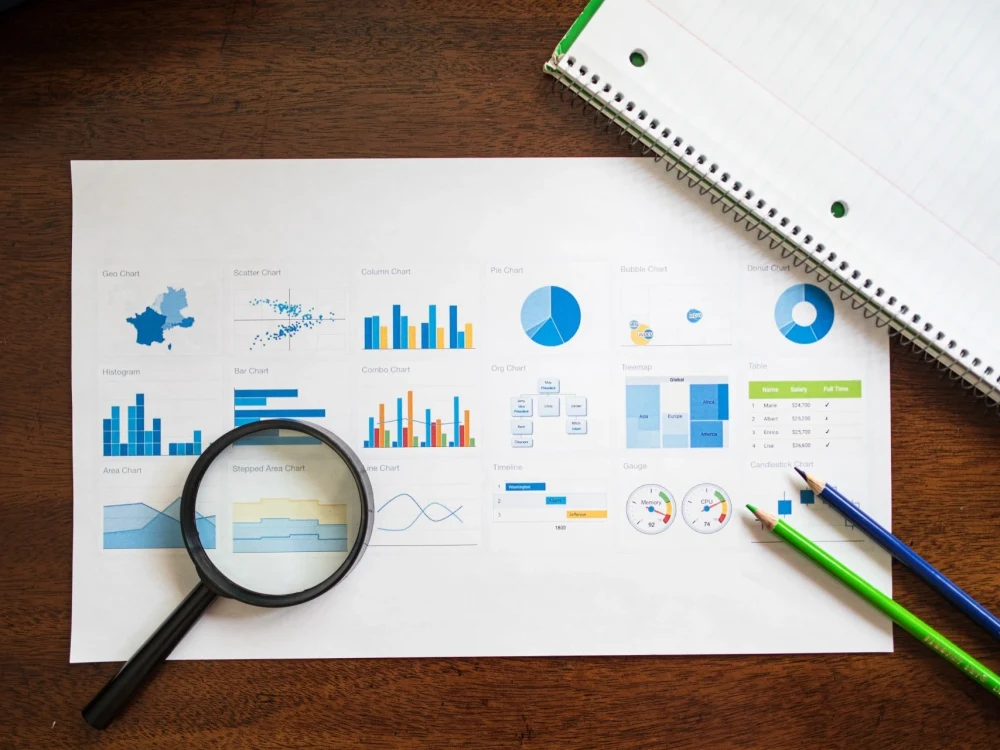
Creating interactive visualizations using libraries such as Matplotlib, Seaborn, Plotly and Bokeh
Creating dashboards and interactive reports using libraries such as Dash and Jupyter Notebook
Creating beautiful dashboards and reports using Tableau, Google Looker Studio and Microsoft Power BI
Creating visualizations for different domains such as business, finance, healthcare and more.
I am proficient in using Python for data visualization, and I am well-versed in a wide range of visualization libraries and frameworks. I have experience in creating interactive visualizations that can be used for data exploration and storytelling.
As a freelancer, I am passionate about helping clients communicate their data effectively and make it easily understandable.
Feel free to contact me anytime.
My expertise includes:
Data cleaning and preparation for visualization
Creating interactive visualizations using libraries such as Matplotlib, Seaborn, Plotly and Bokeh
Creating dashboards and interactive reports using libraries such as Dash and Jupyter Notebook
Creating beautiful dashboards and reports using Tableau, Google Looker Studio and Microsoft Power BI
Creating visualizations for different domains such as business, finance, healthcare and more.
I am proficient in using Python for data visualization, and I am well-versed in a wide range of visualization libraries and frameworks. I have experience in creating interactive visualizations that can be used for data exploration and storytelling.
As a freelancer, I am passionate about helping clients communicate their data effectively and make it easily understandable.
Feel free to contact me anytime.
Data Tool
PythonWhat's included
| Service Tiers |
Starter
$50
|
Standard
$80
|
Advanced
$150
|
|---|---|---|---|
| Delivery Time | 2 days | 4 days | 7 days |
Number of Revisions | 1 | 3 | 5 |
Number of Graphs/Charts | 1 | 2 | 5 |
Number of Variations | 1 | 2 | 4 |
Data Source Connectivity | |||
Web Embedding | - | - | |
Interactive/Animated Visuals | - | - |
Optional add-ons
You can add these on the next page.
Fast Delivery
+$20 - $50
Additional Revision
+$10
Additional Graph/Chart
(+ 1 Day)
+$10Frequently asked questions
About Talal
Geospatial Data Scientist | Machine Learning Expert
Islamabad, Pakistan - 1:19 pm local time
My expertise includes:
Geospatial data management and analysis
Geospatial data visualization
GIS software and programming
Remote sensing
Machine learning and AI techniques for geospatial data
Applications of GIS & remote sensing in various domains such as natural resources management, urban planning, smart cities and more.
I am well-versed in using various GIS software such as ArcGIS, QGIS, and ENVI and I have knowledge of programming languages like Python, R for geospatial data analysis and manipulation. I am also proficient with AI and machine learning techniques for geospatial data, such as object detection, image classification and time series analysis.
As a freelancer, I am passionate about utilizing my expertise in GIS, remote sensing, and AI to help organizations gain insights from their geospatial data and make better decisions. I am able to work independently and provide valuable advice to clients in various industries such as environmental conservation, urban development, transportation, and many more.
Please feel free to contact me to discuss how I can help you with your projects.
Steps for completing your project
After purchasing the project, send requirements so Talal can start the project.
Delivery time starts when Talal receives requirements from you.
Talal works on your project following the steps below.
Revisions may occur after the delivery date.
Gather data and requirements
Create Visualizations