You will get - “Design a Smart Excel Dashboard for Business Insights” - “Clean, Analyze
Project details
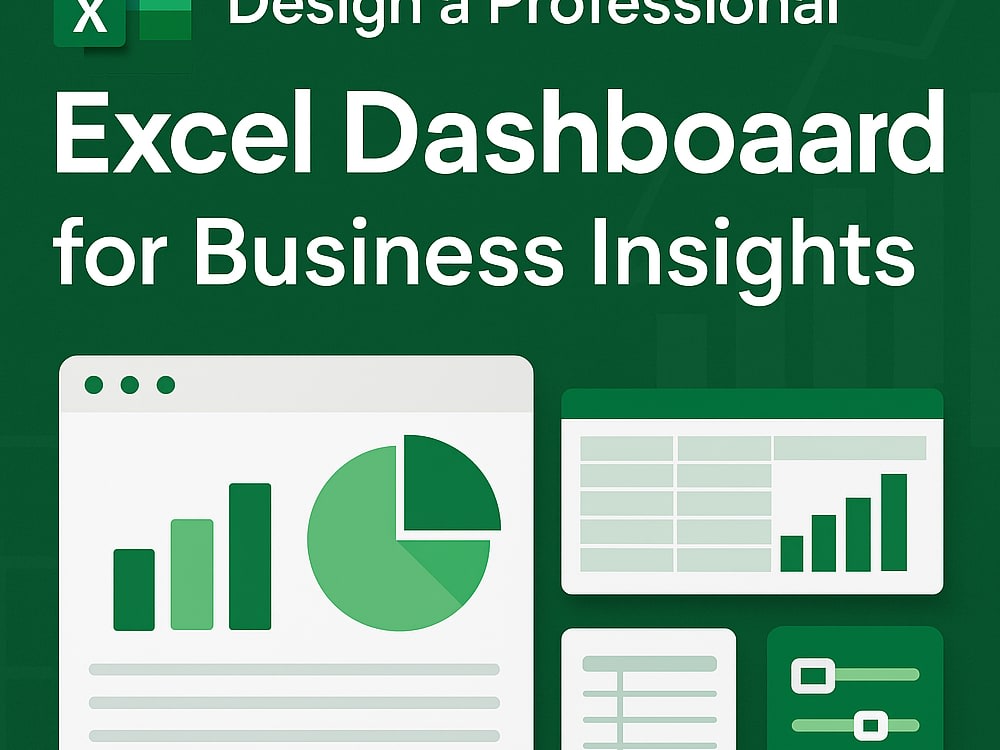
This project involves designing a dynamic and visually engaging Excel dashboard tailored to the client’s business needs. The dashboard will transform raw data into actionable insights using advanced Excel features such as pivot tables, slicers, charts, and conditional formatting.
Key deliverables include:
• Clean and interactive layout with user-friendly navigation
• Automated calculations and summary metrics
• Visual elements like bar charts, pie charts, and trend lines
• Custom filters and slicers for real-time data exploration
• Branded formatting aligned with client preferences
The dashboard will be optimized for clarity, performance, and decision-making, ensuring that stakeholders can easily interpret key metrics and trends. Whether for sales tracking, financial analysis, or operational reporting, the final product will be both functional and presentation ready.
Data Tool
Microsoft ExcelWhat's included
| Service Tiers |
Starter
$25
|
Standard
$50
|
Advanced
$90
|
|---|---|---|---|
| Delivery Time | 2 days | 3 days | 5 days |
Number of Revisions | 1 | 2 | 3 |
About Miss
- Microsoft Excel & Word Specialist Clean, Fast, Reliable
Jaipur, India - 12:19 am local time
Hello! I'm Priyanka Choudhary, a passionate and detail-oriented professional with advanced expertise in Microsoft Excel and MS Word. I specialize in transforming raw data into meaningful insights and creating polished, interactive dashboards and documents that tell a compelling story.
💼 What I Offer:
- ✅ Custom Excel Dashboards with slicers, pivot tables & calculated columns
- ✅ Data Cleaning, Analysis & Visualization
- ✅ Automated Reports using formulas & conditional formatting
- ✅ Professional MS Word Templates, Reports & Formatting
- ✅ Fast, accurate, and reliable delivery with clear communication
🎯 Whether you're a business owner needing performance tracking, a researcher looking for clean data presentation, or a team needing well-structured documentation—I bring clarity, creativity, and precision to every project.
Let’s turn your data into decisions and your documents into impact. Ready to collaborate? Let’s connect!
Steps for completing your project
After purchasing the project, send requirements so Miss can start the project.
Delivery time starts when Miss receives requirements from you.
Miss works on your project following the steps below.
Revisions may occur after the delivery date.
- Requirement Gathering
I collect all necessary inputs from the client—data files, objectives, design preferences, and functionality needs.
- Initial Review & Planning
I analyze the data or content, understand the goal, and plan the dashboard or document structure accordingly.