You will get Dynamic Excel Dashboard for Sales Data Analysis
Project details
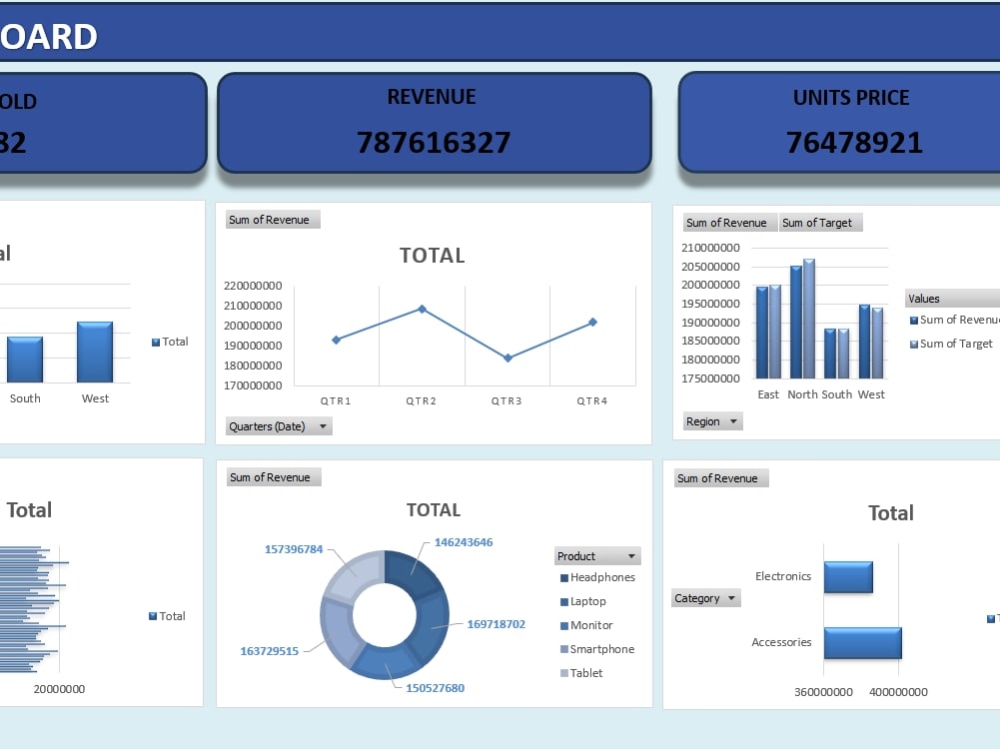
Designed a dynamic Excel Sales Dashboard to track and visualize key performance indicators such as total sales, revenue by region, product-wise sales trends, and monthly performance comparisons. Utilized pivot tables, charts, slicers, and advanced formulas (e.g., VLOOKUP, IF, SUMIFS) to automate data analysis and reporting. The dashboard allows for real-time filtering and easy interpretation, helping clients make faster and data-driven decisions. Delivered a clean, interactive, and client-customized solution to improve operational insights.
Data Tool
Microsoft ExcelWhat's included
| Service Tiers |
Starter
$9
|
Standard
$16
|
Advanced
$34
|
|---|---|---|---|
| Delivery Time | 1 day | 2 days | 2 days |
Number of Revisions | 1 | 2 | 2 |
Number of Pages Mined/Scraped | 1 | 2 | 2 |
Number of Sources Mined/Scraped | 1 | 1 | 2 |
Optional add-ons
You can add these on the next page.
Fast Delivery
+$1 - $2
Additional Revision
+$2
Additional Page Mined/Scraped
(+ 1 Day)
+$4
Additional Source Mined/Scraped
(+ 1 Day)
+$5About Sudhan
Excel & Google Sheets Expert | VLOOKUP, Pivot Table, Reports Dashboard
Madurai, India - 12:49 am local time
I help businesses clean, format, and analyze their data to make smarter decisions. Whether you need dashboards, automated reports, VLOOKUP/HLOOKUP functions, or Pivot Tables, I can deliver fast and accurate results.
✔️ VLOOKUP, HLOOKUP, XLOOKUP
✔️ Pivot Tables, Charts & Dashboards
✔️ Data Cleaning & Validation
✔️ Excel Automation & Formatting
✔️ Google Sheets Expertise
Steps for completing your project
After purchasing the project, send requirements so Sudhan can start the project.
Delivery time starts when Sudhan receives requirements from you.
Sudhan works on your project following the steps below.
Revisions may occur after the delivery date.
Once I get the raw file, I’ll review it and contact if needed.