You will get Climate Dashboard: Landscape Character Assessment Using Google Earth Engine
Project details
✅For custom modifications, please chat with us before making a purchase
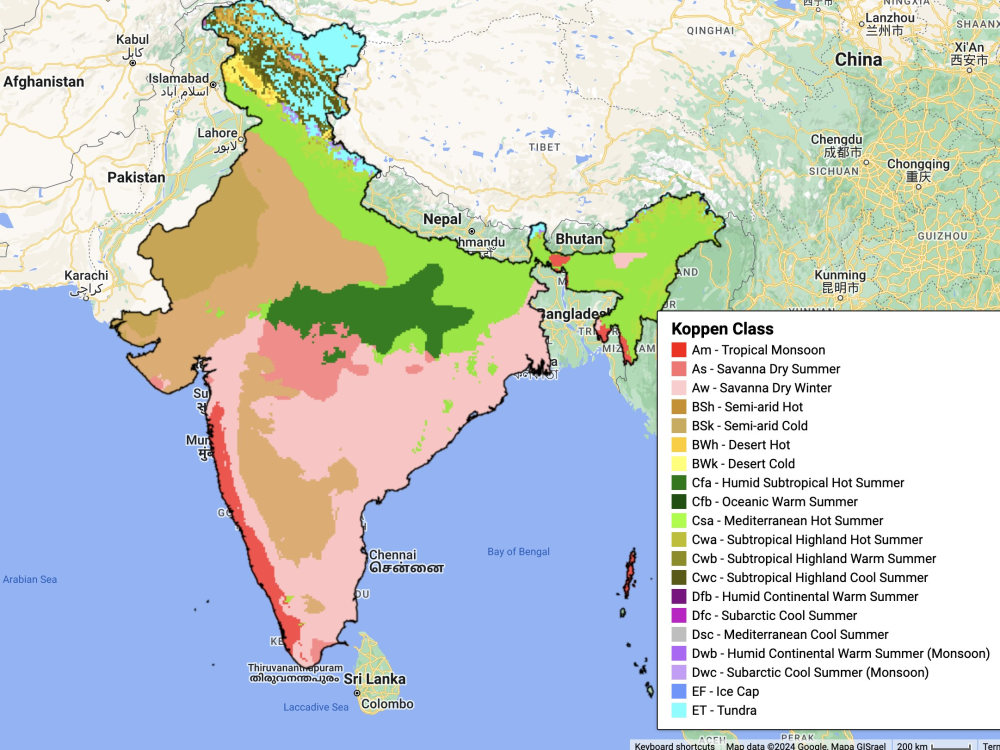
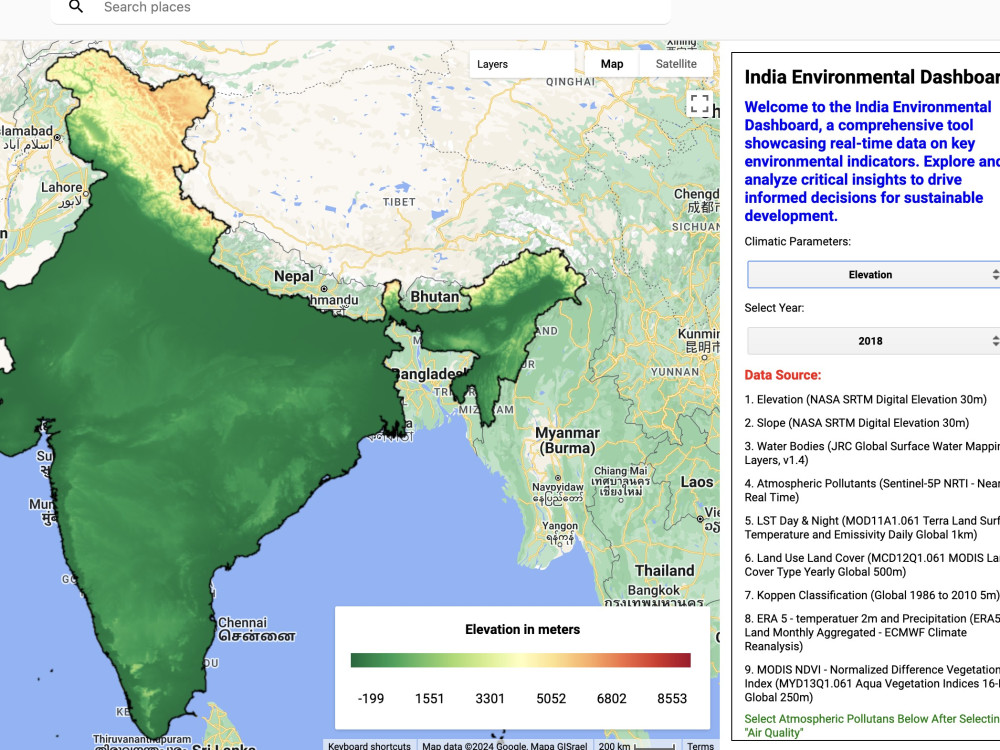
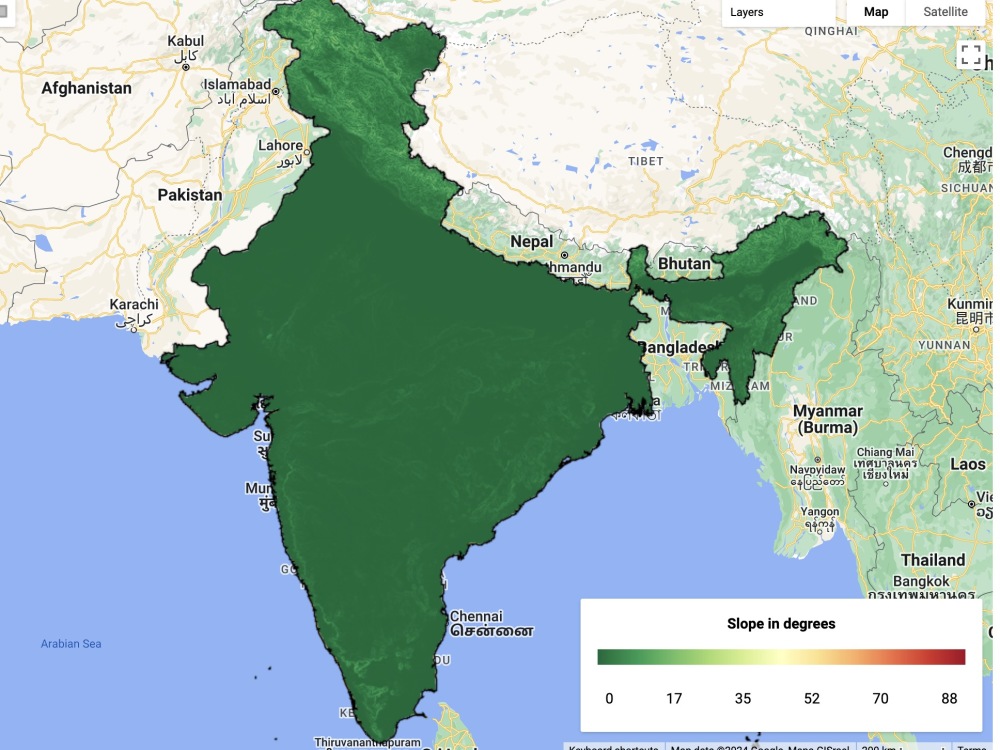
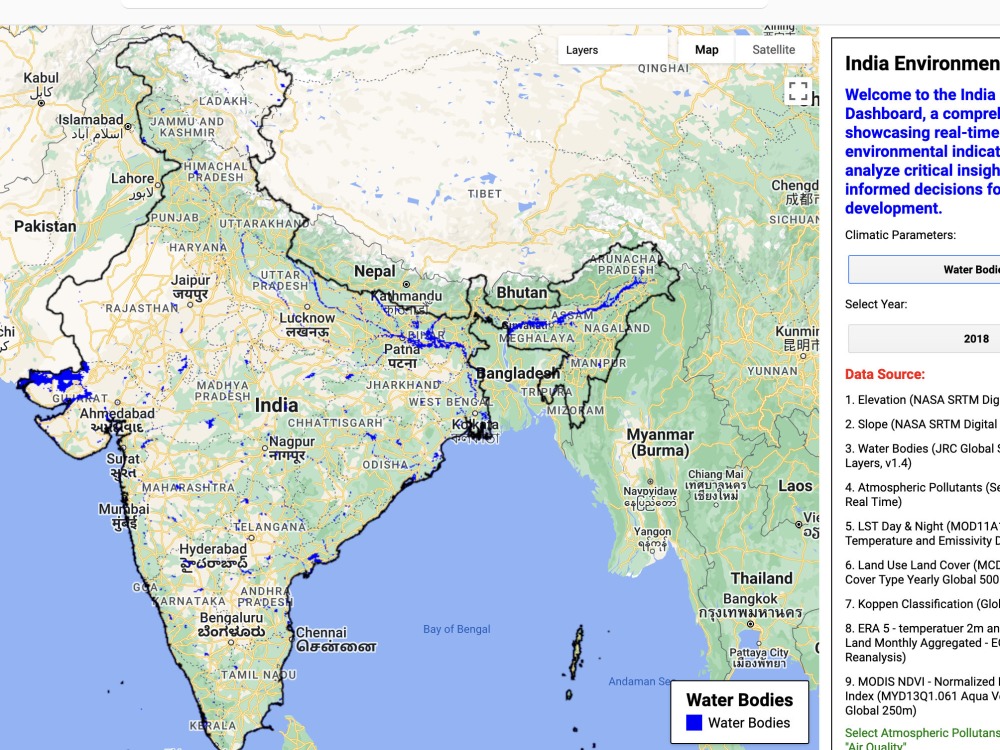
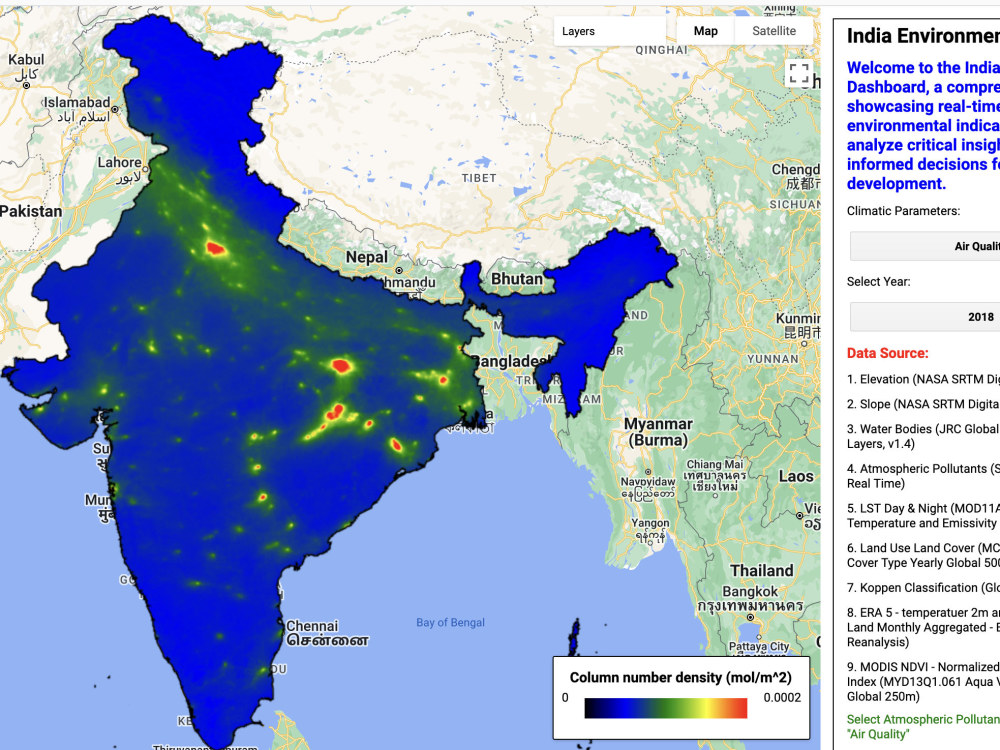
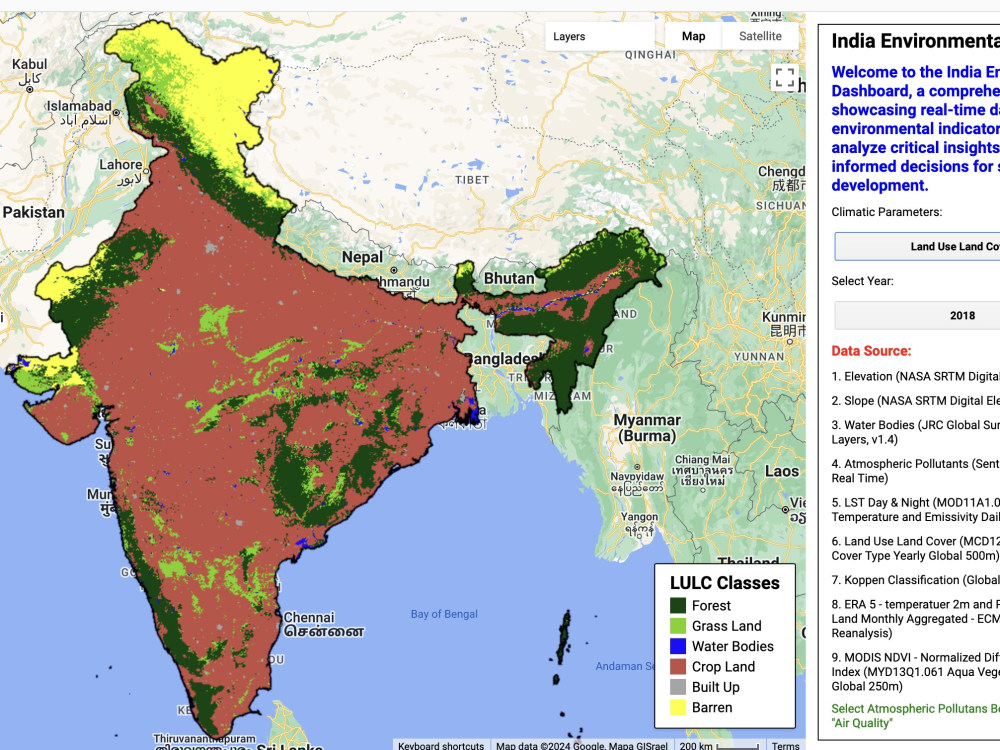
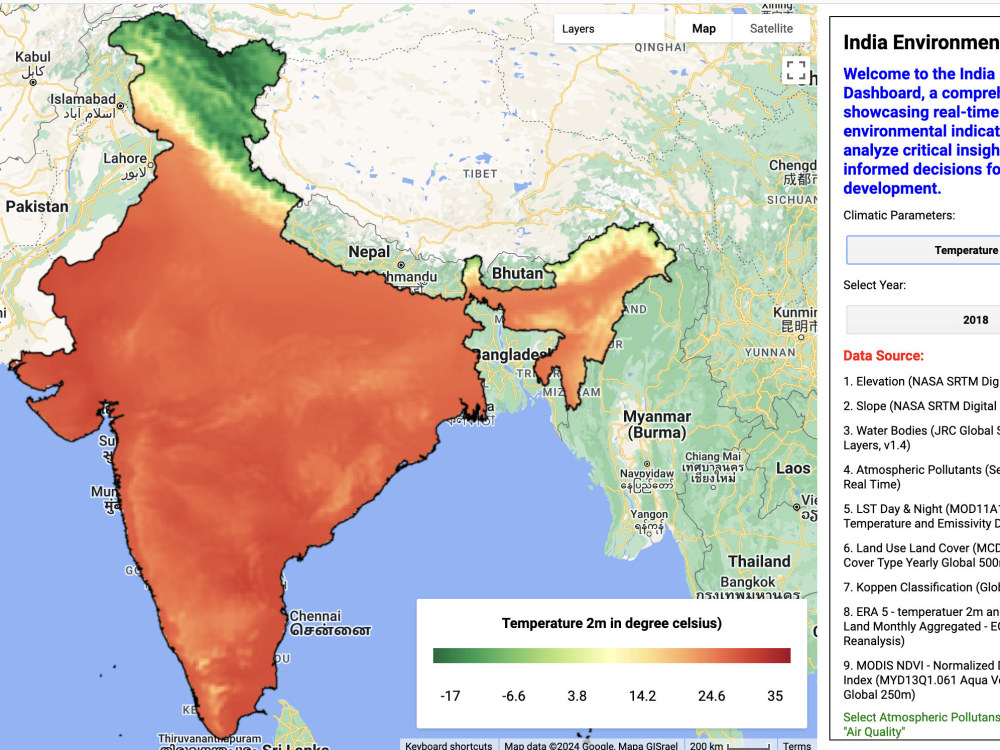
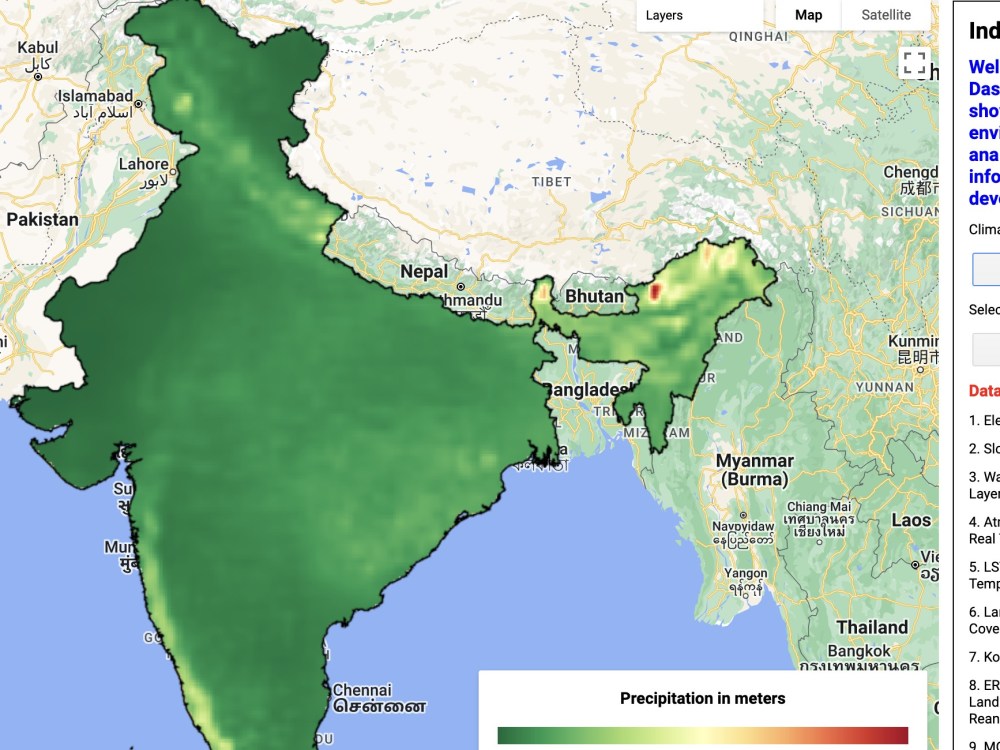
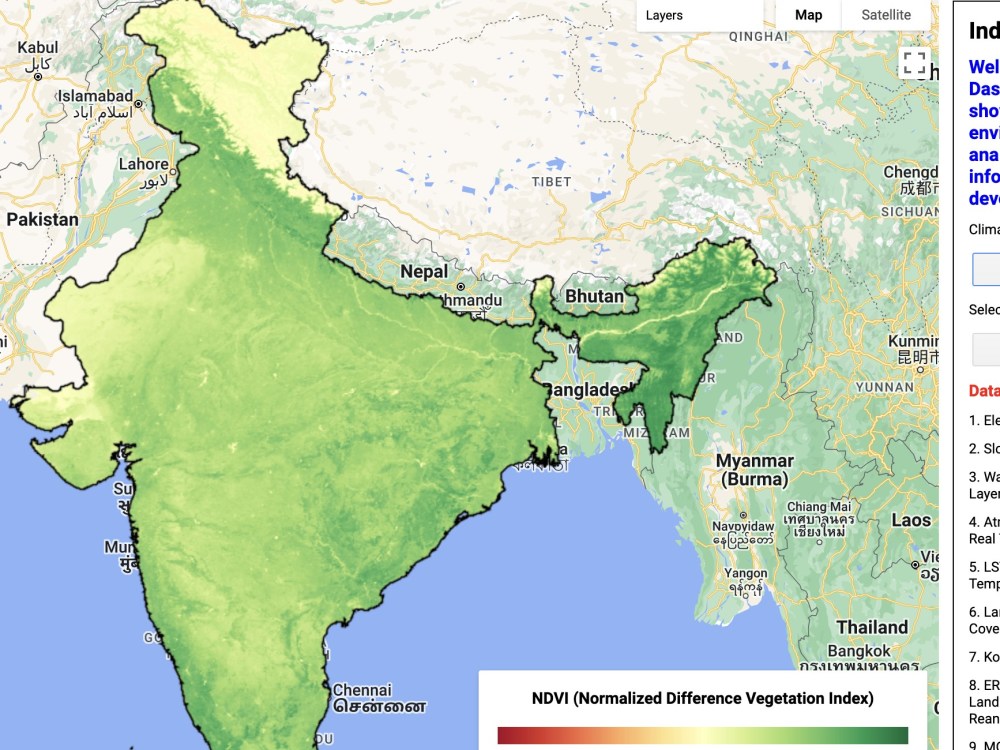
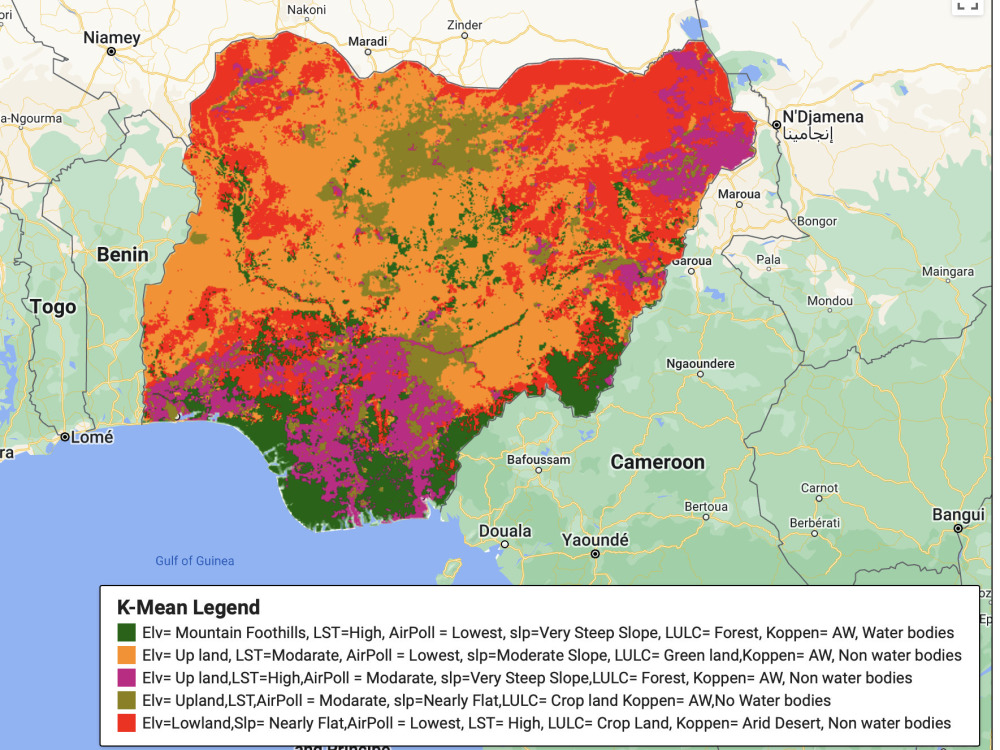
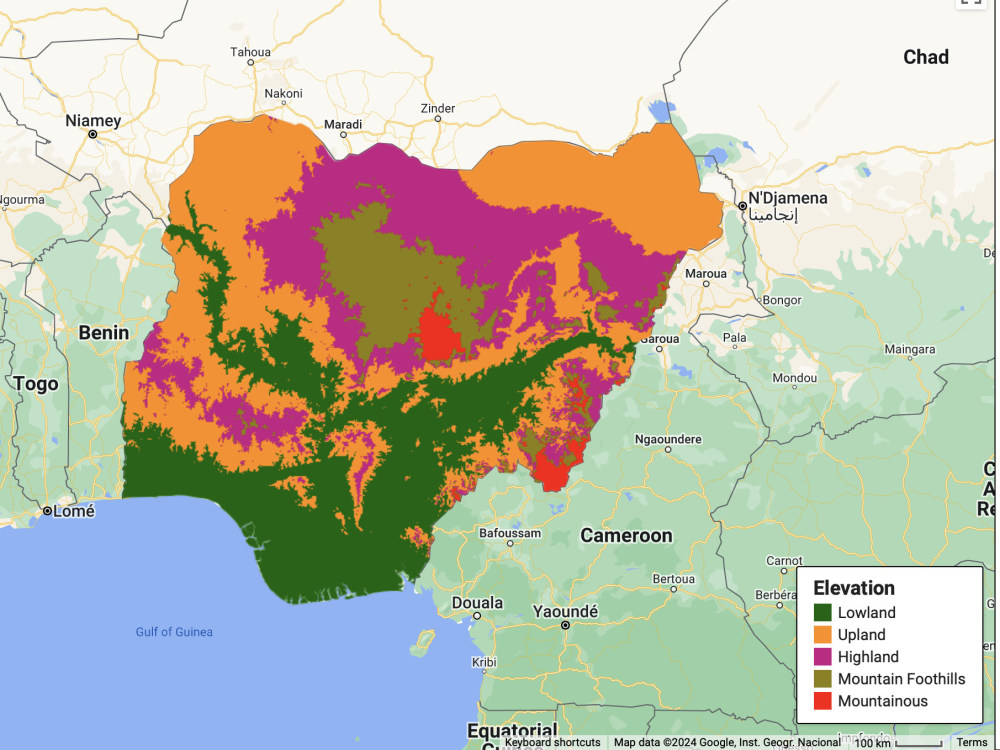
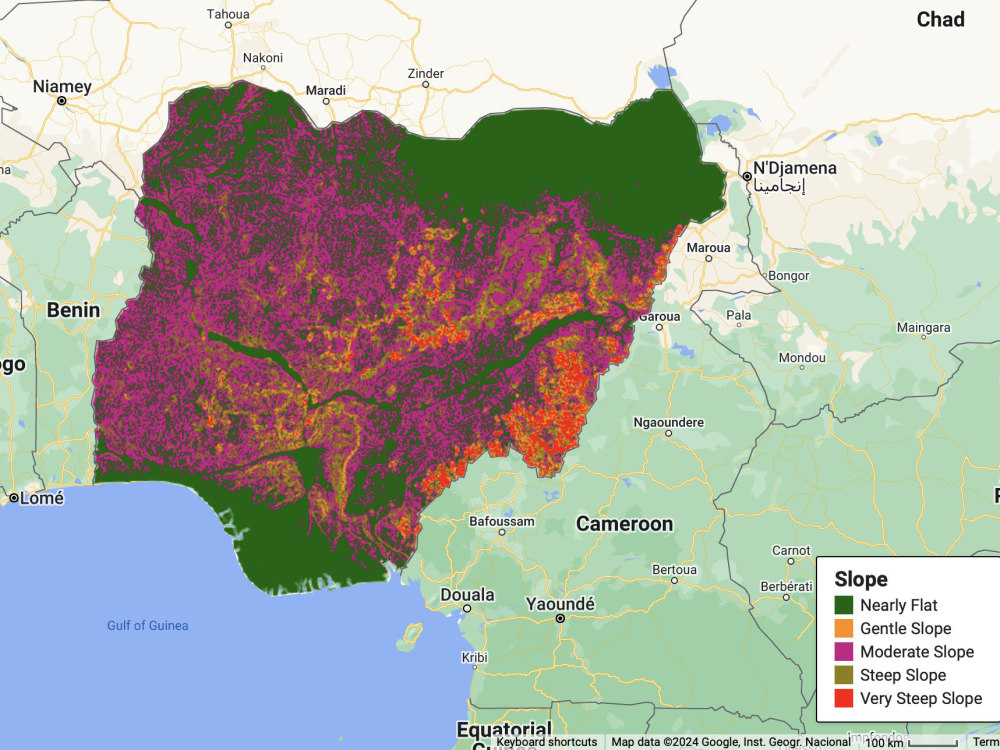
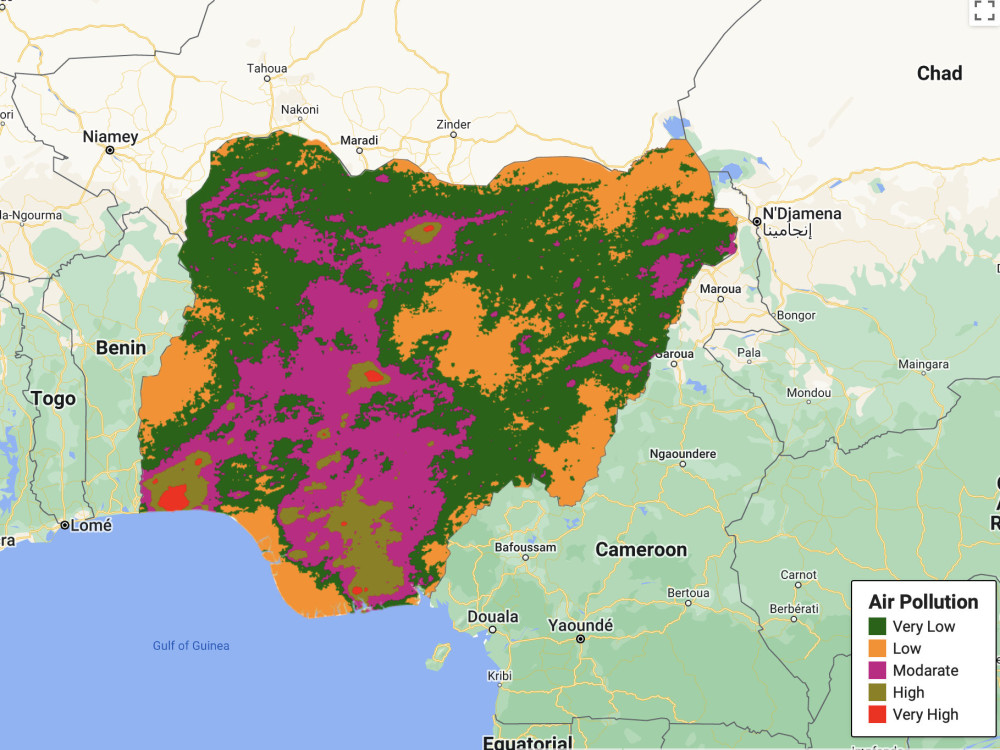
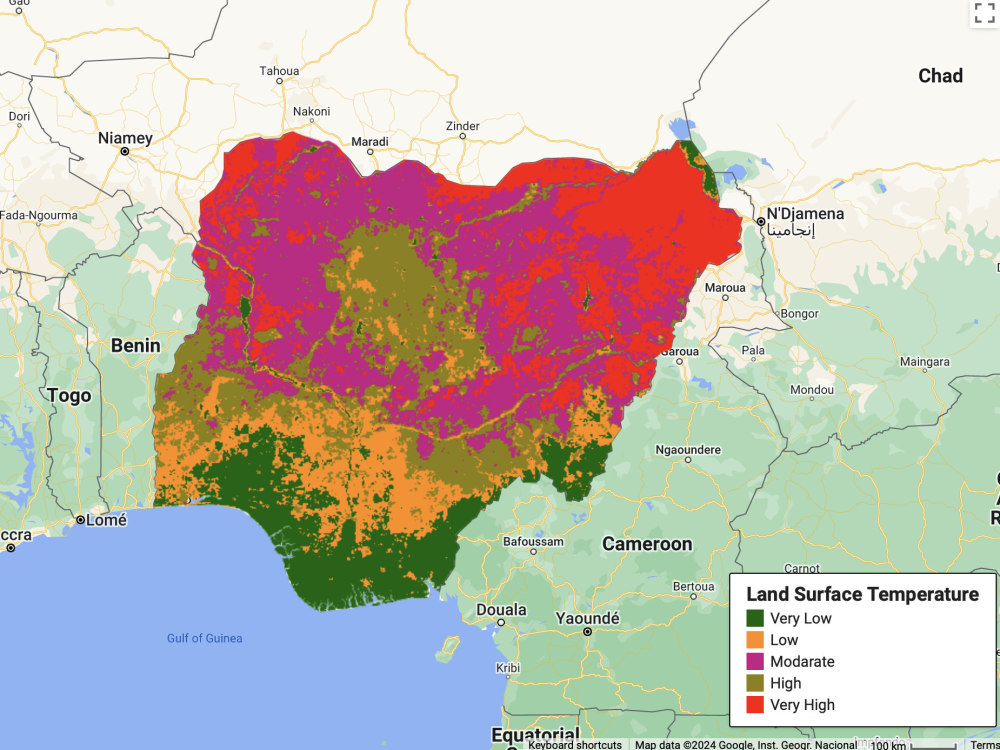
This project develops an interactive Climate Dashboard to provide insights into various biophysical phenomena using geospatial techniques. Integrating environmental layers like elevation, slope, water bodies, proximity to water bodies, air pollution, land surface temperature (LST), land use land cover (LULC), and Köppen climate classification, the dashboard leverages satellite data from Landsat, Sentinel, MODIS, and model data from SRTM, COPERNICUS, and MERRA. Utilizing Google Earth Engine (GEE), the project applies segmentation and clustering algorithms to create detailed landscape character maps. Users can select different layers and years to visualize specific biophysical phenomena, with dynamic map displays updating based on inputs. Each layer includes a legend with color-coded labels for accurate interpretation. The Climate Dashboard offers a comprehensive tool for understanding landscape characteristics through advanced geospatial analysis, facilitating data-driven decision-making for environmental management and policy formulation.
This project develops an interactive Climate Dashboard to provide insights into various biophysical phenomena using geospatial techniques. Integrating environmental layers like elevation, slope, water bodies, proximity to water bodies, air pollution, land surface temperature (LST), land use land cover (LULC), and Köppen climate classification, the dashboard leverages satellite data from Landsat, Sentinel, MODIS, and model data from SRTM, COPERNICUS, and MERRA. Utilizing Google Earth Engine (GEE), the project applies segmentation and clustering algorithms to create detailed landscape character maps. Users can select different layers and years to visualize specific biophysical phenomena, with dynamic map displays updating based on inputs. Each layer includes a legend with color-coded labels for accurate interpretation. The Climate Dashboard offers a comprehensive tool for understanding landscape characteristics through advanced geospatial analysis, facilitating data-driven decision-making for environmental management and policy formulation.
Programming Languages
JavaScript, Python, JavaWhat's included
| Service Tiers |
Starter
$50
|
Standard
$150
|
Advanced
$300
|
|---|---|---|---|
| Delivery Time | 5 days | 7 days | 15 days |
Number of Revisions | 0 | 0 | 0 |
Design Customization | |||
Content Upload | |||
Responsive Design | |||
Source Code |
7 reviews
(5)
(2)
(0)
(0)
(0)
This project doesn't have any reviews.
HB
Hemang B.
Dec 26, 2024
Satellite Image Processing Developer
Did Amazing work..!
AM
Amr M.
Jul 17, 2024
Web Scraping & Data Visualization for Industrial Gases Producers, Indust. Zones, & Customer in Egypt
Sankar immediately understood the task and reacted quickly to show me his first draft and end the work on time.
OM
Omar M.
Jun 27, 2024
Meteorologist and/or Air Quality Specialist to help interpret weather and pollution data
WO
Weyala O.
Jun 14, 2024
Satellite data
Sankar understand the satellite data and integrated applications in depth. He commits to tasks outlined, delivers results on schedule . Sankar has great interpersonal and communication skills that makes it very pleasant to work with him. I would highly recommend Sankar services.
WO
Weyala O.
May 18, 2024
Satellite data
Skilled , good subject matter knowledge, Excellent work ethic
About Sankar J
Earth System Scientist & Full-Stack GIS Developer
Dibrugarh, India - 8:42 am local time
🌍 Geospatial Development & Web GIS:
I design and deploy end-to-end geospatial solutions using industry-standard spatial infrastructure. My stack includes GeoServer and MapServer for OGC-compliant spatial services (WMS, WFS, WCS, WPS), ArcGIS Server / ArcGIS Enterprise with custom GP Services, and ArcGIS Online / Portal for enterprise deployments. On the frontend, I build dynamic, map-centric web applications using React.js and Node.js, integrating Leaflet, OpenLayers, ArcGIS JS API, and Mapbox GL JS to deliver polished, responsive interfaces. I consume and publish REST APIs and GeoJSON/OGC services fluently, and architect scalable spatial backends that connect databases (PostGIS, SDE), middleware, and live remote sensing feeds.
🛰️ Remote Sensing, GEE & Cloud Geospatial:
I am deeply proficient in Google Earth Engine (GEE) — both the JavaScript and Python APIs — for large-scale satellite analysis, custom indices, time series extraction, and asset export workflows. I have worked extensively with Sentinel-1/2, Landsat, MODIS, MISR, and CloudSat imagery for flood mapping, LULC change detection, vegetation analysis, and atmospheric retrievals. I also leverage GEE API services to feed live computed outputs directly into web dashboards and geoportals.
🌡️ Climate, Atmospheric Science & Air Quality
My research background spans climate forecasting, air quality assessment, and emissions analysis using model datasets including ERA5, MERRA-2, CAMS, and CHIRPS. I develop emission inventories, airshed-level management frameworks, hot-spot mapping workflows, and sector-specific energy demand forecasts. I have hands-on experience with ionospheric data, PM2.5 retrieval from aerosol constituents, and multi-variable atmospheric visualization pipelines.
Programming & Data Engineering
I code production-ready tools in Python, R, MATLAB, and JavaScript, with strong capabilities in spatial data mining, advanced visualization (Chart.js, Plotly, Matplotlib), and predictive modeling. I have a proven track record converting legacy Fortran, IDL, and Mathematica codebases into modern, maintainable Python frameworks — a rare but highly valuable skill for organizations modernizing their scientific infrastructure.
Dashboards, Portals & Decision Support Systems
I deliver custom geospatial dashboards and monitoring portals — from disaster management platforms and flood monitoring systems to air quality indices and renewable energy assessment tools — using ArcGIS Dashboards, ArcGIS Experience Builder, Power BI, and bespoke React-based interfaces. Every solution is built with real operational users in mind: clean UI, live data integration, and meaningful spatial storytelling.
What sets me apart is the rare combination of scientific rigor and engineering execution. I don't just analyze environmental data — I build the systems that make that analysis accessible, scalable, and actionable for decision-makers on the ground.
Open to projects in: Web GIS development · Remote sensing automation · Climate data pipelines · Environmental monitoring platforms · GeoServer/MapServer deployment · ArcGIS Enterprise solutions · GEE scripting & API integration
Steps for completing your project
After purchasing the project, send requirements so Sankar J can start the project.
Delivery time starts when Sankar J receives requirements from you.
Sankar J works on your project following the steps below.
Revisions may occur after the delivery date.
Climate Dashboard: Landscape Character Assessment Using Google Earth Engine
This project aims to develop an interactive Climate Dashboard, integrating environmental layers like elevation, slope, water bodies air pollution, LST, LULC, and Köppen climate classification.