You will get Excel dashboard, data analysis, pivot tables, and reports
Project details
Struggling with messy data, manual reporting, or lack of clear insights?
I help turn raw data into structured, meaningful, and visually appealing dashboards using Microsoft Excel.
From data cleaning to advanced reporting, the focus is on delivering accurate analysis and easy-to-understand dashboards that support better business decisions.
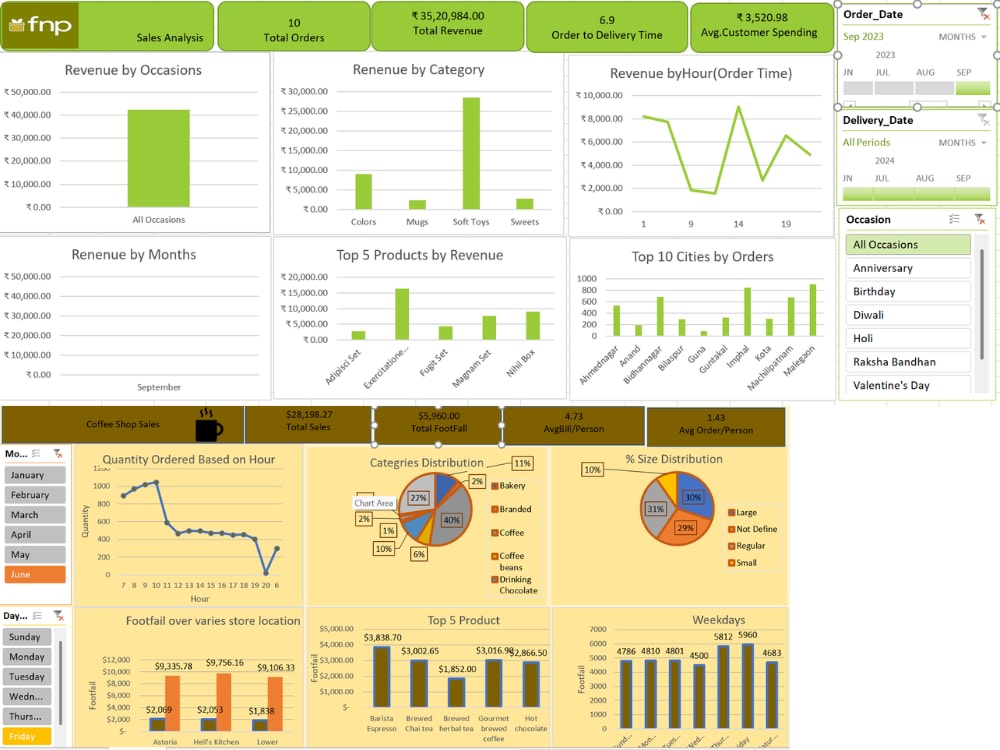
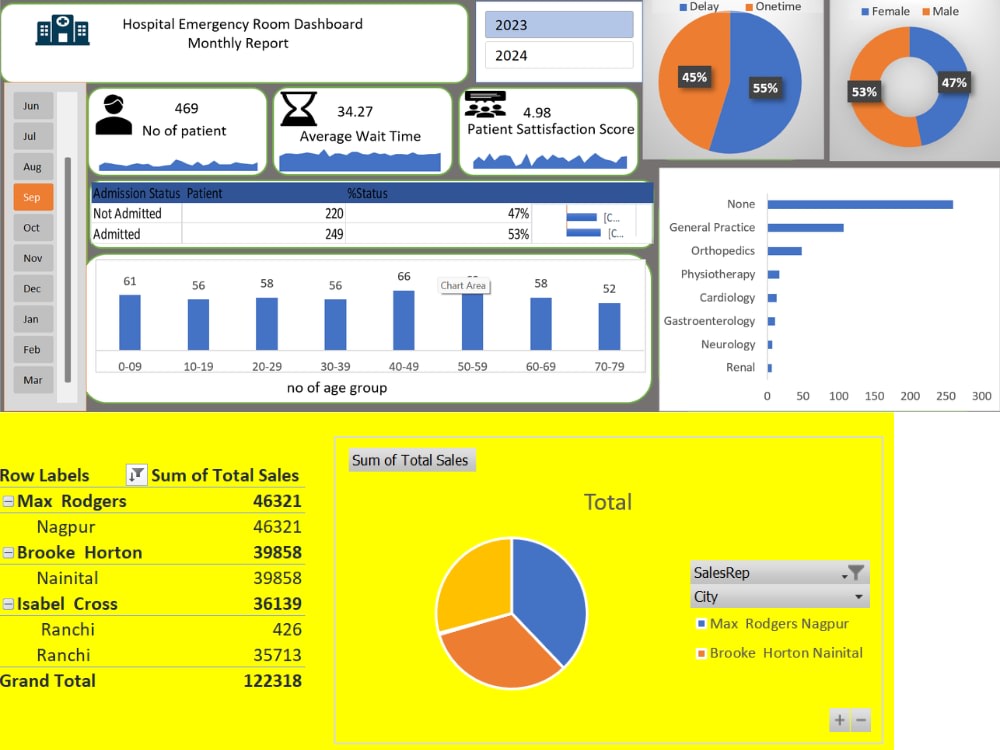
Experience includes working with datasets, building dynamic Excel dashboards, using Pivot Tables, and applying advanced formulas to improve reporting efficiency.
The result: clean data, automated reports, and actionable insights.
I help turn raw data into structured, meaningful, and visually appealing dashboards using Microsoft Excel.
From data cleaning to advanced reporting, the focus is on delivering accurate analysis and easy-to-understand dashboards that support better business decisions.
Experience includes working with datasets, building dynamic Excel dashboards, using Pivot Tables, and applying advanced formulas to improve reporting efficiency.
The result: clean data, automated reports, and actionable insights.
Data Tool
Microsoft ExcelWhat's included
| Service Tiers |
Starter
$5
|
Standard
$15
|
Advanced
$100
|
|---|---|---|---|
| Delivery Time | 1 day | 2 days | 4 days |
Number of Revisions | 3 | 3 | 3 |
Optional add-ons
You can add these on the next page.
Additional Revision
+$5About Sarwar
Microsoft Excel Expert | Power BI Specialist | Data Analyst
Purnia, India - 3:54 am local time
In complex business environments, raw data alone does not create value. Transforming unstructured datasets into actionable insights requires expertise in data cleaning, data modeling, and visualization. Through hands-on experience, large datasets have been optimized using advanced Excel functions (VLOOKUP, XLOOKUP, INDEX-MATCH, Power Query), automated with VBA macros, and integrated into dynamic dashboards that significantly reduced reporting time and improved operational efficiency.
Performance-driven Power BI implementations have enabled stakeholders to move from static reports to real-time business intelligence. Interactive dashboards, DAX-based calculations, and data modeling techniques have consistently improved KPI tracking, forecasting accuracy, and executive-level reporting. These solutions have led to measurable outcomes such as reduced manual workload, faster turnaround times, and improved data accuracy across departments.
Working with demanding clients has required maintaining high standards of data integrity, scalability, and performance. Deliverables have consistently aligned with business objectives, ensuring clarity in reporting, automation in workflows, and reliability in analytics systems. The ability to identify inefficiencies, design data-driven solutions, and execute them with precision has resulted in improved decision-making processes and enhanced operational performance.
Core expertise includes
-Data Analysis, Data Visualization
-Business Intelligence, Dashboard Development
-Data Cleaning, Data Transformation
-Power BI, Microsoft Excel, Power Query, DAX, VBA Automation
-KPI Reporting, Data Modeling, and Reporting Automation
Steps for completing your project
After purchasing the project, send requirements so Sarwar can start the project.
Delivery time starts when Sarwar receives requirements from you.
Sarwar works on your project following the steps below.
Revisions may occur after the delivery date.
Requirement Analysis
Understand your business needs, dataset, and key objectives to ensure accurate results.
Data Cleaning & Preparation
Organize and clean raw data in Microsoft Excel by removing errors, duplicates, and inconsistencies.