You will get Excel Inventory Dashboard for Stock Tracking and Business Analysis
Project details
I will create a professional Excel Inventory Management Dashboard to help you monitor stock performance and make better business decisions. This dashboard provides clear insights into inventory levels, stock value, reorder status, supplier performance, and product categories.
Using Microsoft Excel, Pivot Tables, charts, and data visualization techniques, I will design an interactive dashboard that allows you to quickly understand your inventory data and identify important trends.
The dashboard can include metrics such as total stock value, low-stock products, reorder levels, supplier performance, and warehouse distribution.
You will receive a clean, easy-to-use, and customizable Excel dashboard that helps improve inventory tracking, reporting, and operational efficiency.
Data Tool
Microsoft ExcelWhat's included
| Service Tiers |
Starter
$25
|
Standard
$60
|
Advanced
$120
|
|---|---|---|---|
| Delivery Time | 3 days | 5 days | 7 days |
Number of Revisions | 2 | 3 | 5 |
Number of Pages Mined/Scraped | 1 | 1 | 1 |
Number of Sources Mined/Scraped | 1 | 1 | 1 |
Optional add-ons
You can add these on the next page.
Fast Delivery
+$10 - $20
Additional Revision
+$10Frequently asked questions
About Lakshmish
Data Analyst | Excel Dashboards | Data Visualization | MIS Reporting
Bengaluru, India - 3:20 pm local time
I help businesses organize their data, analyze performance, and build interactive dashboards that support better decision-making. My focus is on creating clean, easy-to-understand reports and automated dashboards that allow teams to track KPIs, monitor performance, and identify trends quickly.
What I can help you with
• Excel Data Analysis
• Interactive Excel Dashboards
• MIS Reporting & Business Reports
• Data Cleaning and Data Transformation
• Pivot Tables & Advanced Excel Formulas
• KPI Tracking Dashboards
• Inventory Management Dashboards
• Call Center Performance Dashboards
• Business Performance Reports
I have experience building dashboards that analyze large datasets and provide insights such as stock performance, call center analytics, agent performance, sales trends, product analysis, and operational metrics.
Example projects I have built
✔ Inventory Management Dashboard
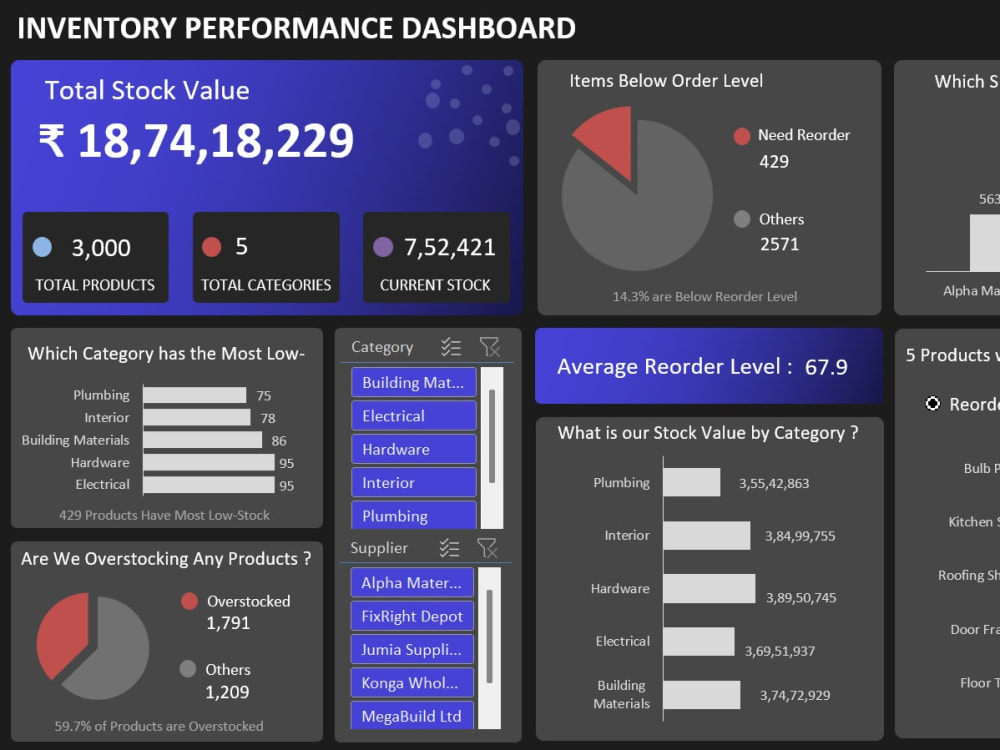
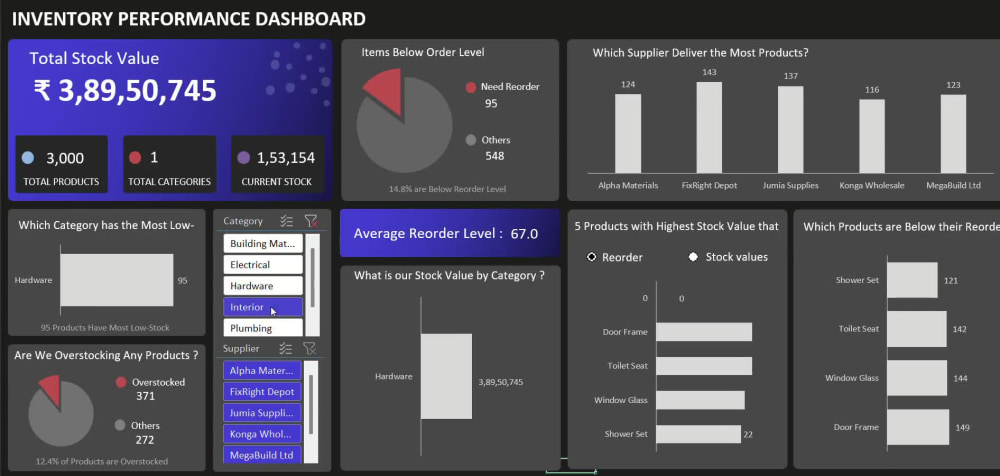
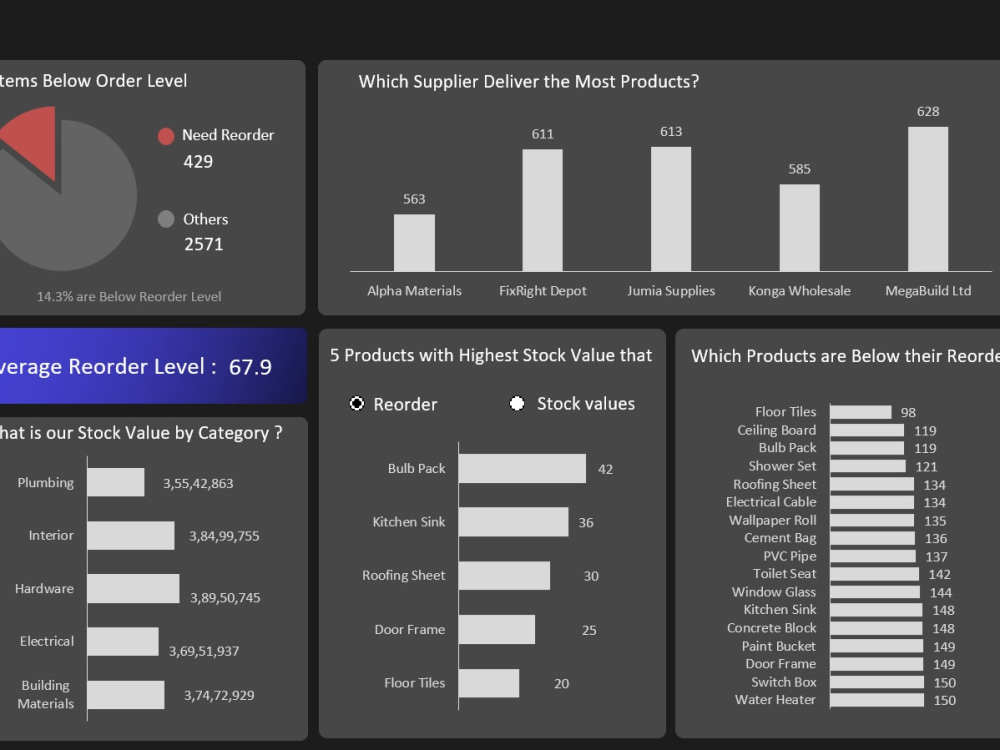
Analyzed stock levels, reorder points, supplier performance, and product categories to help businesses monitor inventory and prevent stock shortages.
✔ Sales & Marketing Call Center Dashboard
Built a performance dashboard to track total calls, successful and failed calls, abandoned calls, agent performance, monthly trends, and geographic customer distribution.
These dashboards use pivot tables, charts, KPIs, slicers, and dynamic filters to make data exploration easy and interactive.
My working approach
1. Understand your business requirements and KPIs
2. Clean and organize the dataset
3. Build a structured data model
4. Create interactive dashboards and visualizations
5. Deliver a clear, professional, and easy-to-use solution
Why work with me?
✔ Clear and professional dashboards
✔ Clean and well-structured Excel models
✔ Accurate data analysis and reporting
✔ Reliable communication and timely delivery
✔ Focus on practical insights that help business decisions
My goal is not just to create charts but to turn data into meaningful insights that help businesses grow and improve performance.
If you need help with Excel dashboards, data analysis, MIS reports, or business data visualization, feel free to reach out. I would be happy to discuss your project and help you get the most value from your data.
Steps for completing your project
After purchasing the project, send requirements so Lakshmish can start the project.
Delivery time starts when Lakshmish receives requirements from you.
Lakshmish works on your project following the steps below.
Revisions may occur after the delivery date.
Data Review and Preparation
I will review the inventory dataset provided by the client, clean the data if needed, and organize it properly to prepare it for dashboard creation and analysis.
Dashboard Development
I will build an interactive Excel dashboard using pivot tables, charts, and KPIs to visualize inventory performance such as stock levels, reorder points, suppliers, and category insights.