You will get fantastic Charts for your Web App
Project details
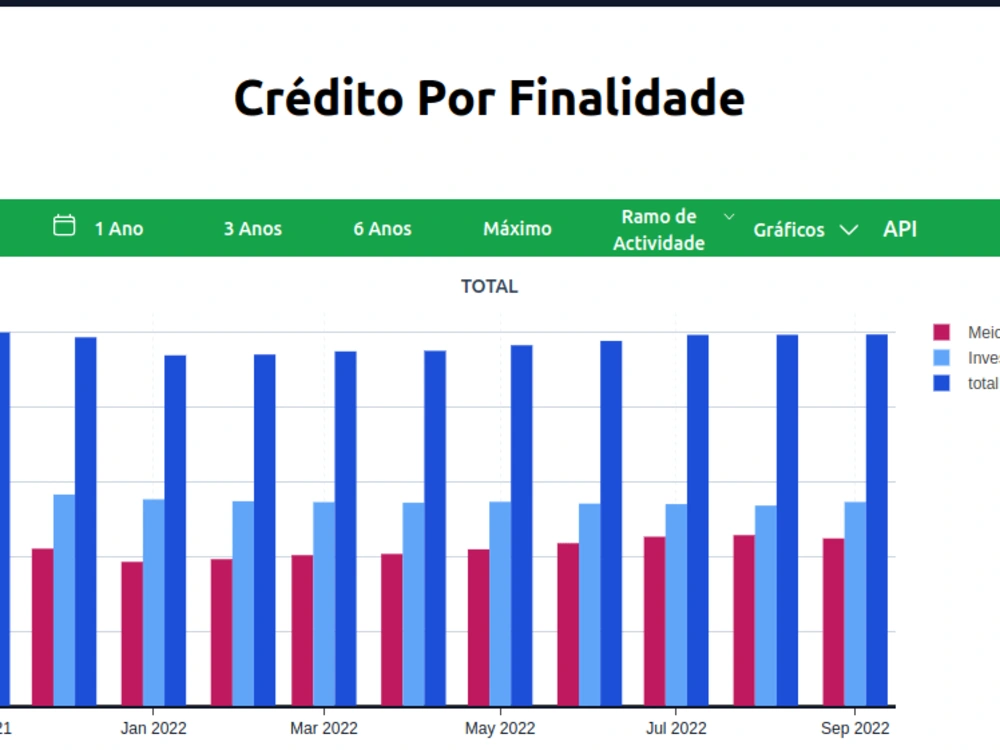
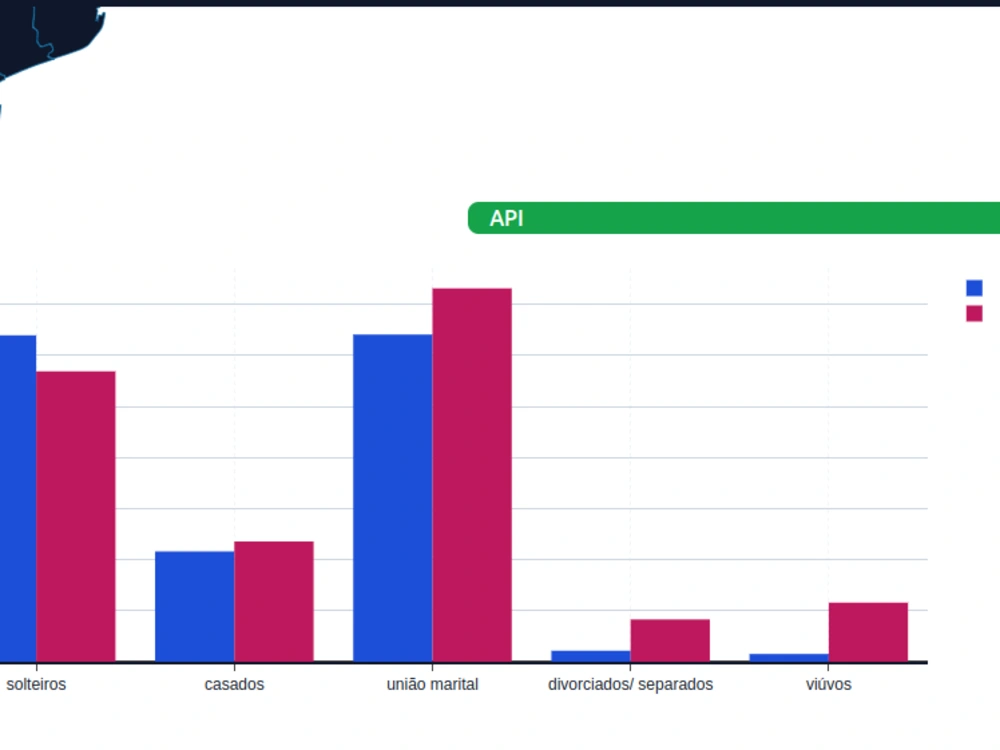
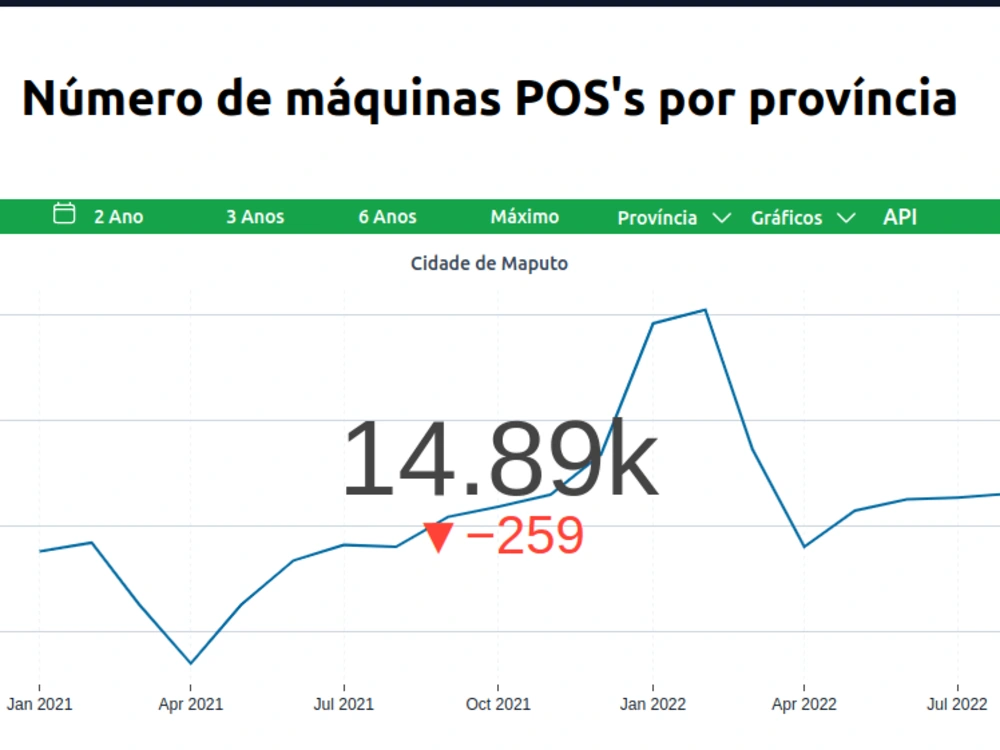
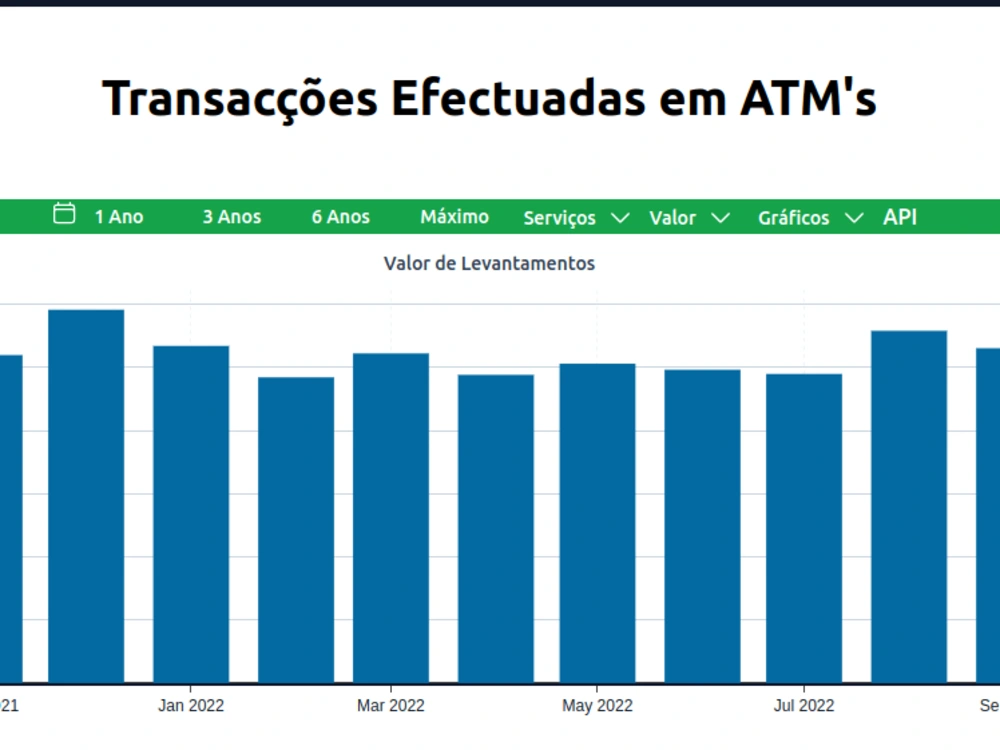
You will get professional Data Visualisation charts developed using the best tools in the market, and best practices in data visualization
Programming Languages
HTML & CSS, JavaScript, TypeScriptCoding Expertise
Cross Browser & Device Compatibility, Performance Optimization, DesignWhat's included
| Service Tiers |
Starter
$25
|
Standard
$39
|
Advanced
$69
|
|---|---|---|---|
| Delivery Time | 1 day | 5 days | 10 days |
Number of Revisions | 1 | 3 | 5 |
Number of Pages | 1 | 3 | 5 |
Design Customization | |||
Content Upload | |||
Responsive Design | |||
Source Code |
Optional add-ons
You can add these on the next page.
Additional Page
(+ 1 Day)
+$25About Arlindo
Javascript Engineer : React, Next.js, Typescript, Node.js,
Matola, Mozambique - 10:01 am local time
I have been interacting with Amazon AWS for most production projects what gives me some experience in the Cloud.
I like to work with a different set of projects to learn and experience multiple fields of work
Lets discuss your project.
Steps for completing your project
After purchasing the project, send requirements so Arlindo can start the project.
Delivery time starts when Arlindo receives requirements from you.
Arlindo works on your project following the steps below.
Revisions may occur after the delivery date.
Provide a Data source
Your API or third-party API that you have access to, a CSV file, or an Excell file.
Provide Web Application
Your existing React.Js or Next.JS web application. If you want to start a new project you should have the design, additional costs might be applied.