You will get Frontend JS Dashboard with Python/JS backend:dictionary string organization
Project details
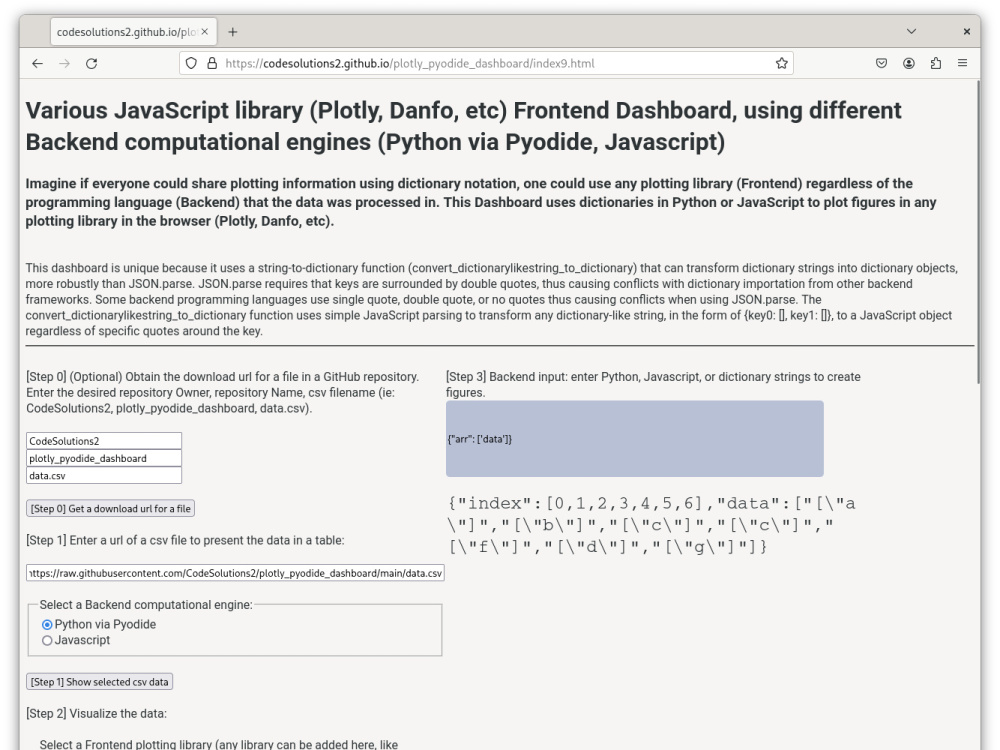
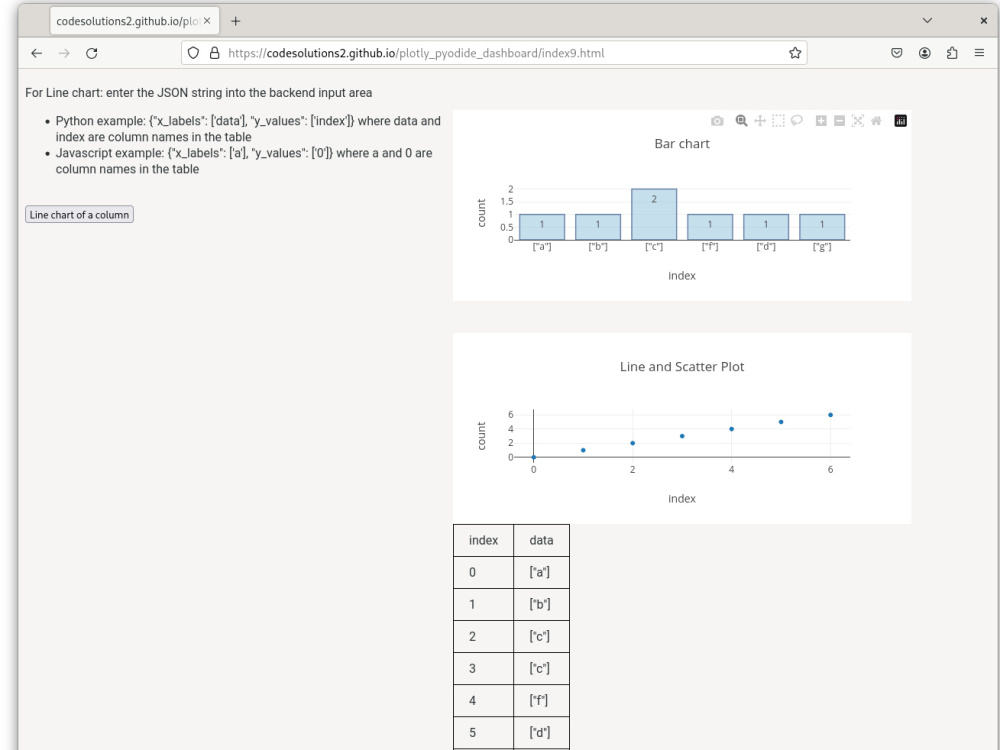
The objective of this work is to create an interchangeable/'plug-in' frontend backend Dashboard, such that different frontend JavaScript libraries could be used with data processed on different computational software (ie: python, Java, JavaScript backends). This dashboard framework is unique because it encourages users to use dictionary format in any backend programming language, such that the dashboard automatically plots data from a dictionary. The dictionary in string format can be saved in GitHub repository files, and/or a template of how the data should be arranged in a dictionary can be stored as strings such that data can be read onto the visualization dashboard.
There are three tiers of this workflow: Simple Dashboard code with 5 types of figures, Complex Dashboard code with at least 10 types of figures, Dashboard w/GitHub REST API code where transformed data in dictionary format can be saved to GitHub repository files.
There are three tiers of this workflow: Simple Dashboard code with 5 types of figures, Complex Dashboard code with at least 10 types of figures, Dashboard w/GitHub REST API code where transformed data in dictionary format can be saved to GitHub repository files.
Programming Languages
HTML & CSS, JavaScript, PythonCoding Expertise
Cross Browser & Device Compatibility, DesignWhat's included
| Service Tiers |
Starter
$200
|
Standard
$400
|
Advanced
$800
|
|---|---|---|---|
| Delivery Time | 7 days | 21 days | 30 days |
Number of Revisions | 0 | 0 | 0 |
Design Customization | |||
Content Upload | - | - | - |
Responsive Design | - | - | - |
Source Code |
About Jamilah
Data Scientist | modeling, cloud, scientific computing
Lyon 03, France - 3:16 am local time
Steps for completing your project
After purchasing the project, send requirements so Jamilah can start the project.
Delivery time starts when Jamilah receives requirements from you.
Jamilah works on your project following the steps below.
Revisions may occur after the delivery date.
Obtain which charts should be displayed on the dashboard from the client.
Verify that data loading to desired charts functions.