You will get Data Visualization, Dashboard, Graphs, Charts, Data Analysis, Pivot Table.
Project details
Transform Your Data into Stunning Dashboards!
Are you ready to visualize your Excel data like never before? With my specialized dashboard services, I offer three tailored packages designed for your specific needs.
Important: Please contact me before making a purchase to ensure the best fit for your project.
What I Offer:
If you require assistance with any of the following, you’re in the right place:
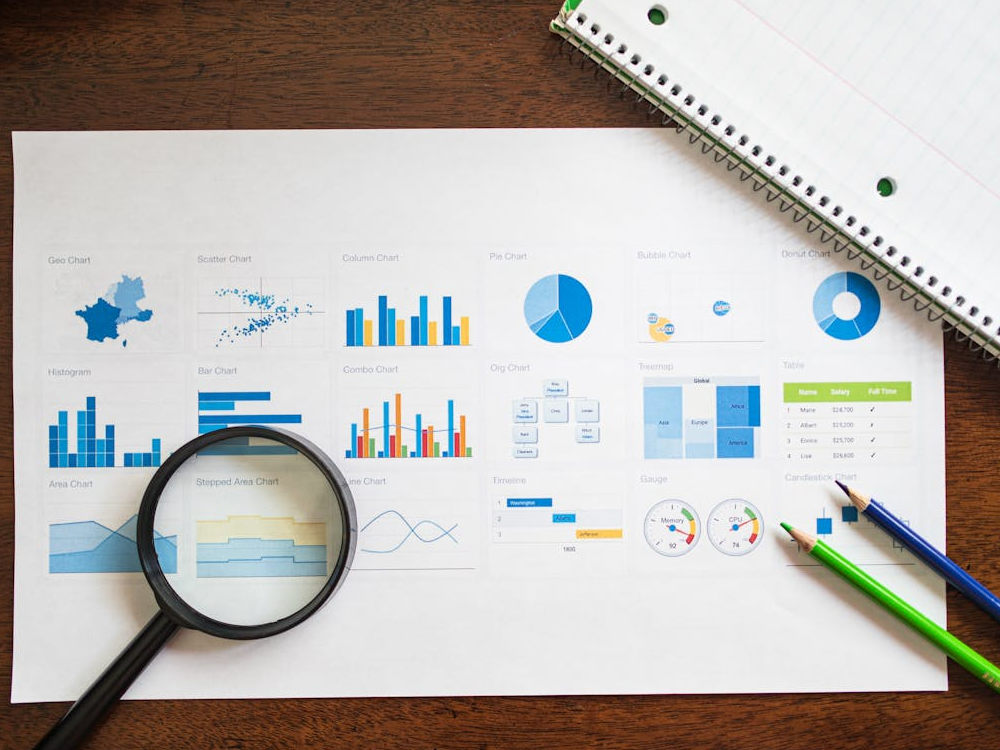
• Excel Dashboards
• File Automation
• Advanced Formulas (XLOOKUP, INDEX/MATCH, COUNTIF, SUMIFS, etc.)
• Pivot Tables and Power Pivot
• Data Automation using Power Query
• Data Cleansing and Filtering
• Combining and Connecting Spreadsheets
• Data Modeling
• Web Scraping
Why Choose Me?
I have completed numerous projects successfully and am dedicated to providing high-quality work at competitive prices. Let’s unlock the full potential of your data together! 😊
My Services Include:
• Excel Functions
• Pivot Tables
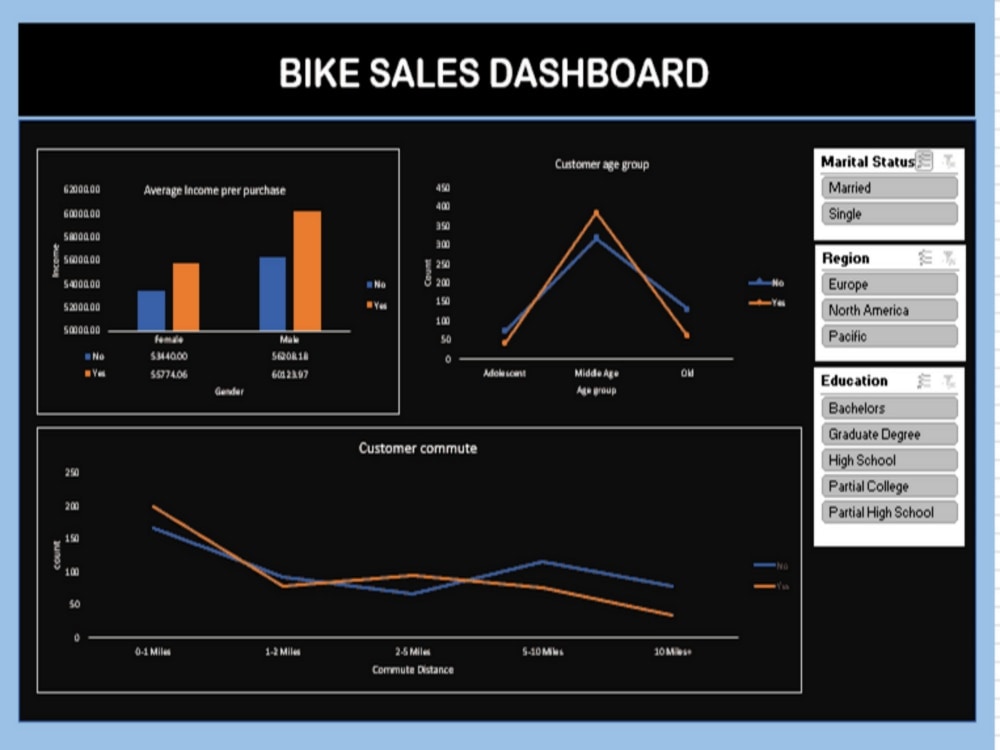
• Data Visualization with Charts
• Customized Dashboards
• Advanced Data Cleansing
• Automation and Data Connections
Get in Touch:Ready to get started? Contact me today to discuss your project and see how I can help you achieve your data visualization goals!
Are you ready to visualize your Excel data like never before? With my specialized dashboard services, I offer three tailored packages designed for your specific needs.
Important: Please contact me before making a purchase to ensure the best fit for your project.
What I Offer:
If you require assistance with any of the following, you’re in the right place:
• Excel Dashboards
• File Automation
• Advanced Formulas (XLOOKUP, INDEX/MATCH, COUNTIF, SUMIFS, etc.)
• Pivot Tables and Power Pivot
• Data Automation using Power Query
• Data Cleansing and Filtering
• Combining and Connecting Spreadsheets
• Data Modeling
• Web Scraping
Why Choose Me?
I have completed numerous projects successfully and am dedicated to providing high-quality work at competitive prices. Let’s unlock the full potential of your data together! 😊
My Services Include:
• Excel Functions
• Pivot Tables
• Data Visualization with Charts
• Customized Dashboards
• Advanced Data Cleansing
• Automation and Data Connections
Get in Touch:Ready to get started? Contact me today to discuss your project and see how I can help you achieve your data visualization goals!
Data Tool
Microsoft ExcelWhat's included
| Service Tiers |
Starter
$25
|
Standard
$35
|
Advanced
$45
|
|---|---|---|---|
| Delivery Time | 1 day | 2 days | 3 days |
Number of Revisions | 2 | 4 | 4 |
Number of Pages Mined/Scraped | 10 | 25 | 50 |
Number of Sources Mined/Scraped | 1 | 2 | 3 |
Optional add-ons
You can add these on the next page.
Fast Delivery
+$5 - $10
Additional Revision
+$1
Additional Page Mined/Scraped
(+ 1 Day)
+$5
Additional Source Mined/Scraped
(+ 1 Day)
+$5Frequently asked questions
About Shadrack
R/Python programmer | Data analysis | Dashboard | Wordpress | powerbi
Nairobi, Kenya - 6:31 am local time
My Expertise:
• Data Cleaning & Integrity: Using Python, R, and Excel, I meticulously clean datasets, handling missing values, outliers, and inconsistencies to ensure accuracy. This step is vital in laying a solid foundation for reliable analysis.
• Data Wrangling & ETL: I’m proficient in extracting, transforming, and loading (ETL) data from diverse sources using tools like Python (Pandas) and R (dplyr, tidyr). My focus is on streamlining data for seamless analysis and reporting.
• Database Management & Optimization: I manage databases with SQL and optimize structures for enhanced performance and accessibility. Whether querying or updating databases, I ensure data integrity and efficiency.
• Web Scraping: Automating real-time data collection through R and Excel, I efficiently extract structured data from websites to fuel timely analysis and reporting.
• Data Visualization & Reporting: I bring data to life through interactive dashboards using Power BI and Excel, and I take this further with dynamic, reproducible reports in R Markdown and Quarto. These tools allow me to blend narrative with analytics, delivering polished, professional reports for stakeholders.
• Exploratory Data Analysis (EDA): Skilled in performing EDA with R, Python, and Excel, I identify data patterns, missing values, outliers, and key distributions, providing comprehensive insights into the dataset’s underlying structure.
• Problem-Solving & Optimization: I thrive on addressing complex analytical challenges and optimizing data processes, enabling organizations to leverage insights that drive strategic decisions.
• Web Design & Development: On the web design front, I create user-friendly personal and business websites using WordPress, ensuring a seamless online presence.
Steps for completing your project
After purchasing the project, send requirements so Shadrack can start the project.
Delivery time starts when Shadrack receives requirements from you.
Shadrack works on your project following the steps below.
Revisions may occur after the delivery date.
Initial Consultation
Understand the project goals, key questions, and specific client needs.
Data Collection & Access
Secure access to all relevant datasets, documentation, and any existing insights.