You will get High Quality Visualizations of Financial and Economic Data
Top Rated
Top Rated
Project details
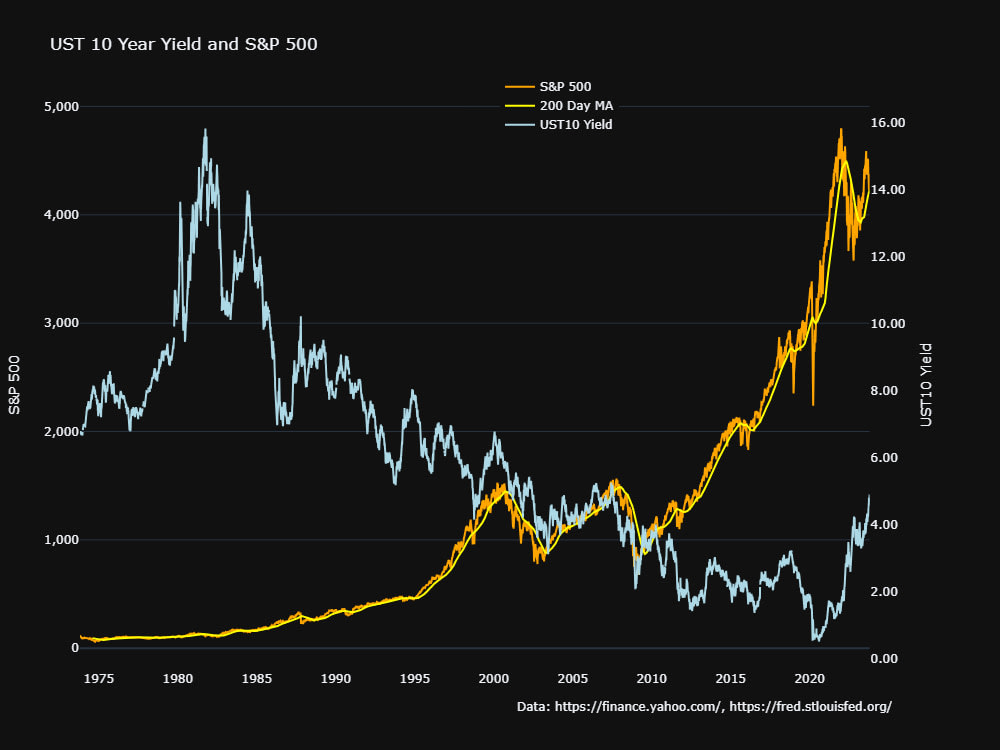
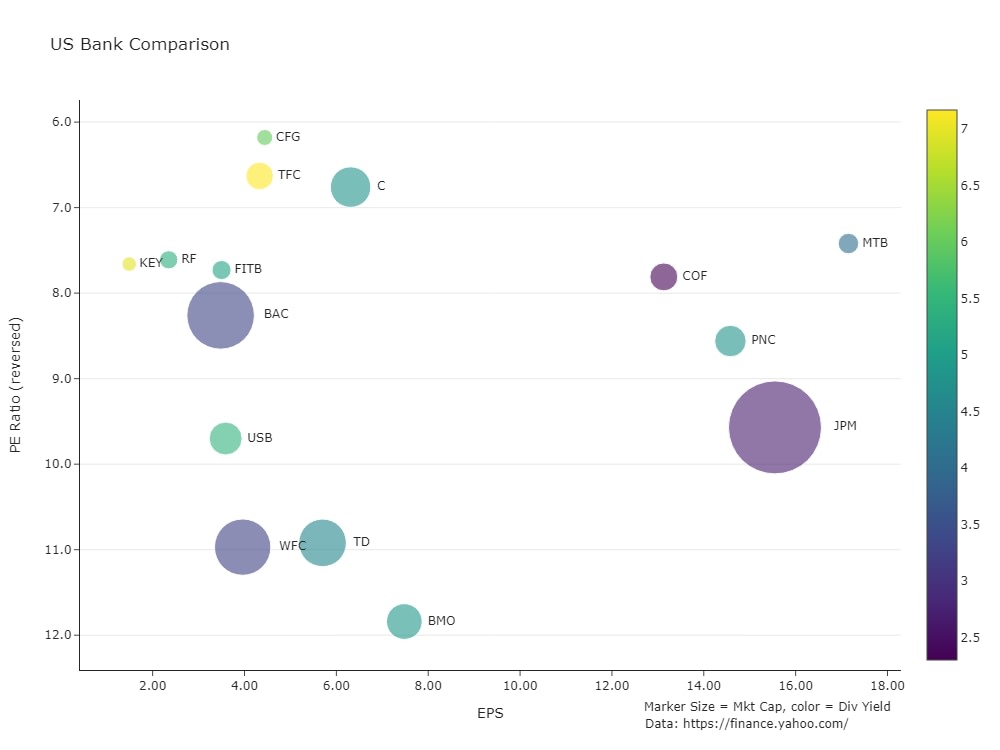
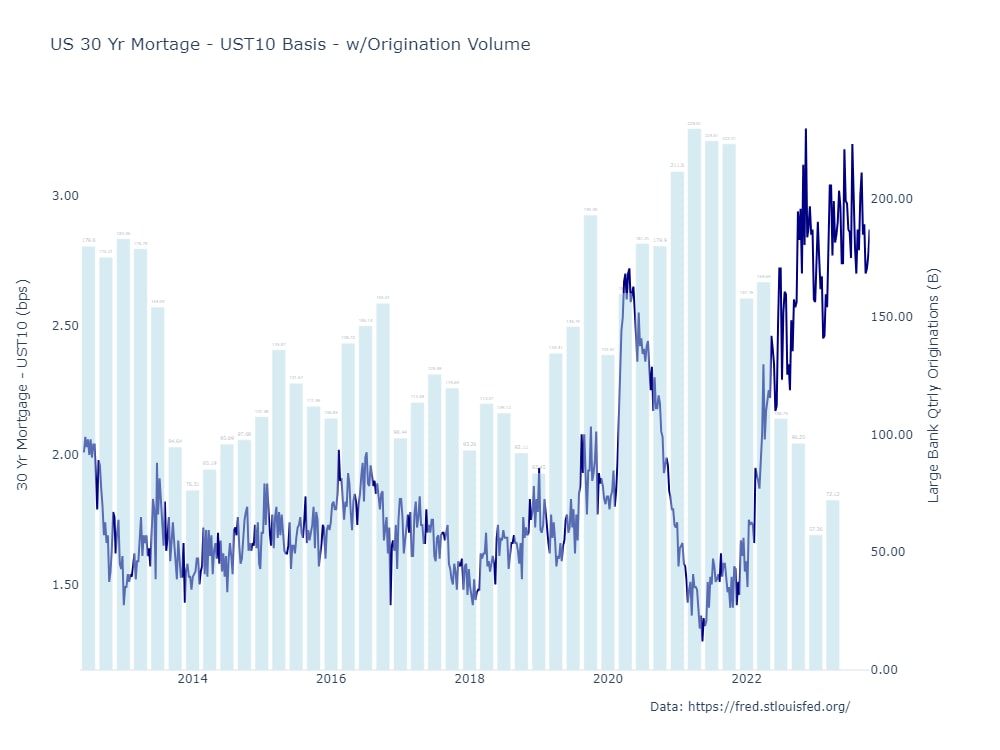
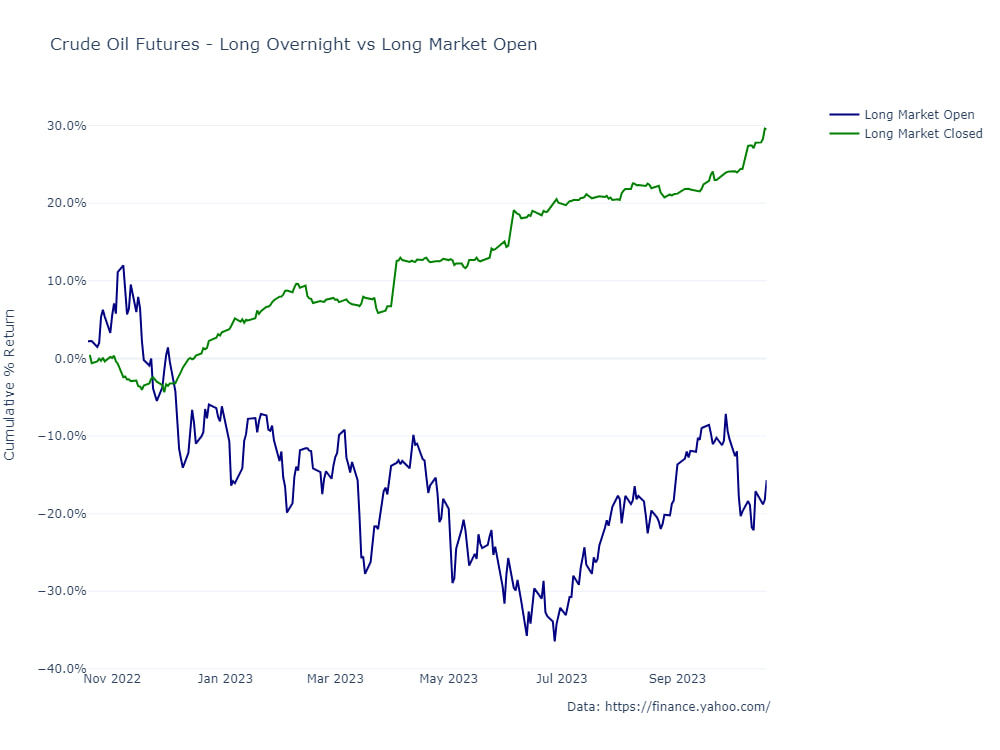
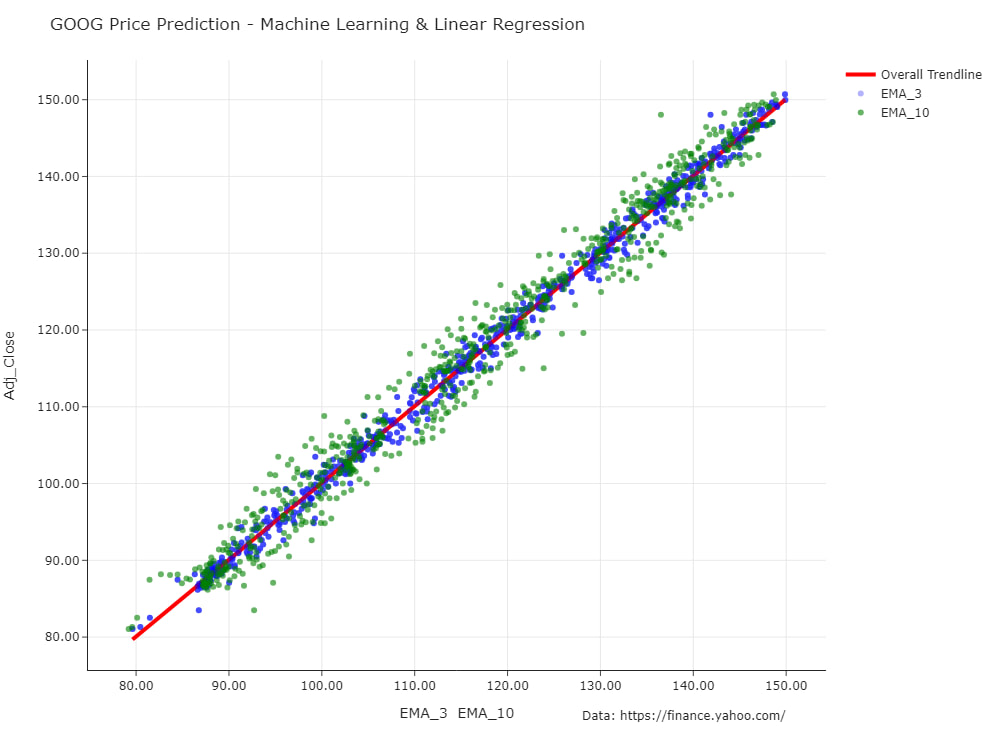
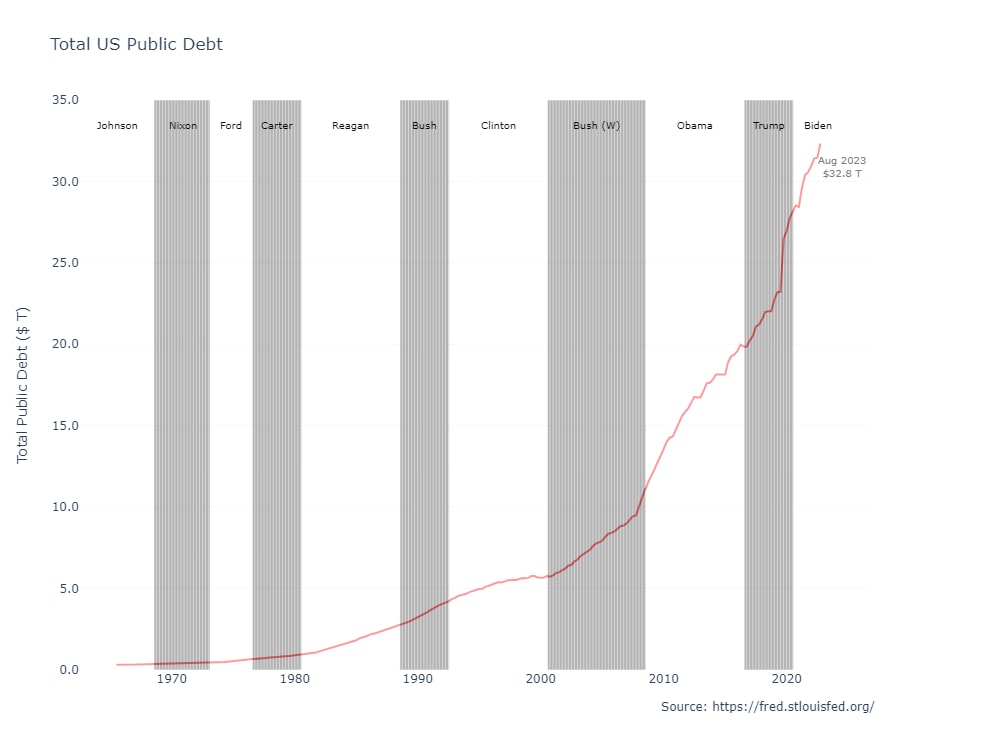
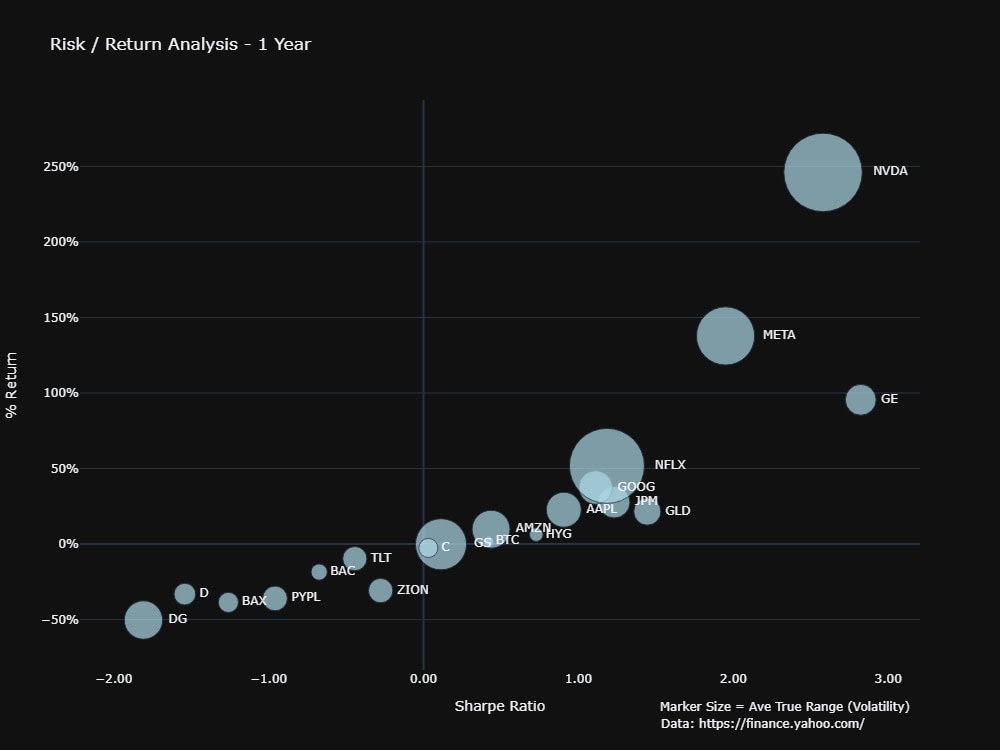
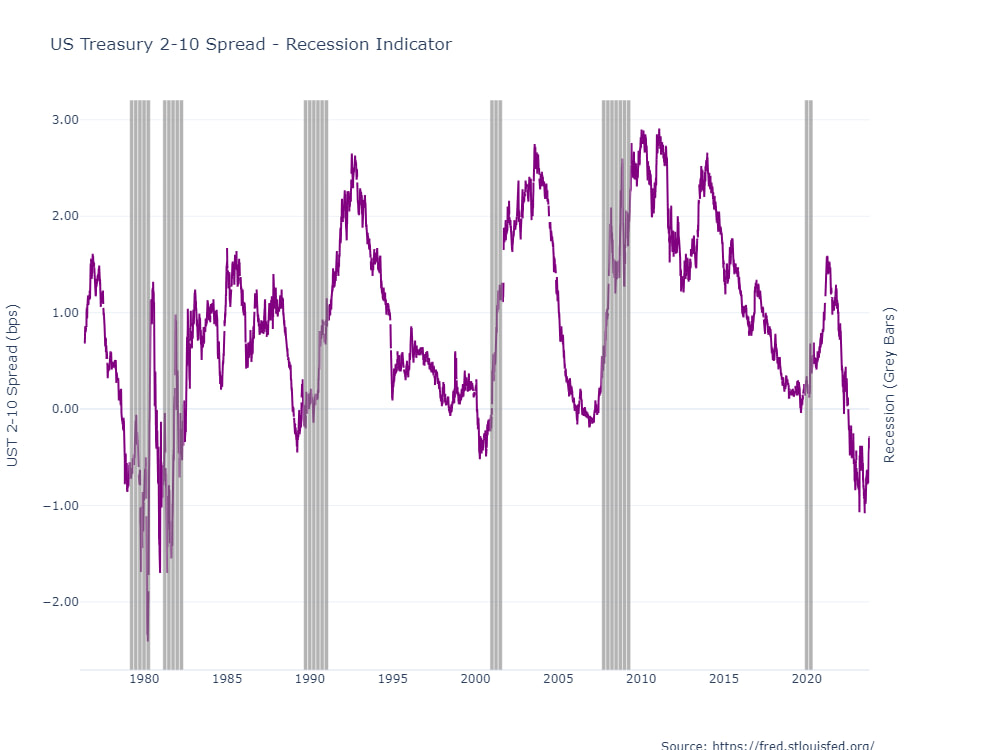
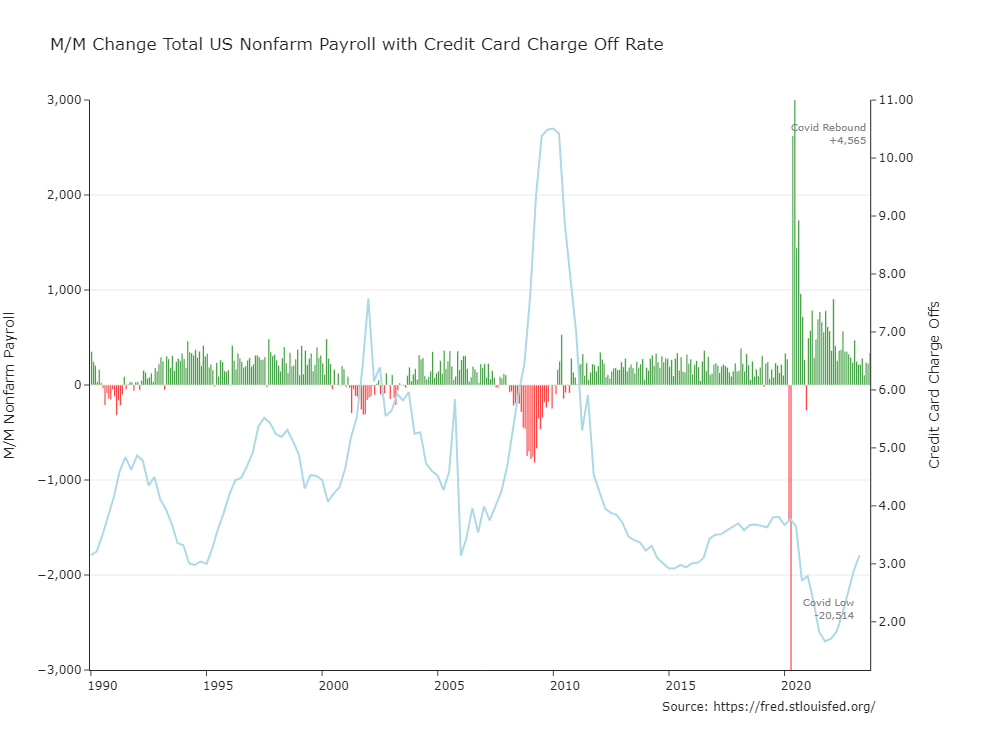
You will get a presentation quality, interactive HTML chart, a static image of the chart, and the source data in an Excel file. Advanced or custom visualizations and chart types that are clean, easily understood, and ready to tell whatever story that you want them to.
Data Tool
PythonWhat's included
| Service Tiers |
Starter
$75
|
Standard
$100
|
Advanced
$250
|
|---|---|---|---|
| Delivery Time | 2 days | 2 days | 3 days |
Number of Revisions | 3 | 3 | 4 |
Number of Graphs/Charts | 1 | 3 | 3 |
Model Documentation | |||
Data Source Connectivity | |||
Model Validation/Testing | - | - | - |
Optional add-ons
You can add these on the next page.
Fast Delivery
+$25 - $50
37 reviews
(37)
(0)
(0)
(0)
(0)
This project doesn't have any reviews.
DW
Dale W.
Feb 13, 2026
Real Estate Financial Model/Proforma Development
KB
Keagan B.
Jul 22, 2025
billboard waterfall model audit
Gilles was professional and responsive and was able to audit my financial model on short notice. I will be using him again.
NJ
Nicolas J.
Jul 22, 2025
Looking for Financial modeler
bm
bobby m.
Jul 22, 2025
Cap Table Review Part 2
great to work with Gilles!
AS
Ariel S.
Jul 15, 2025
Prop Firm Financial Analyst: Model Optimal Put Strategy to Hedge Levered BTC Trade
About Gilles
Former banker with advanced analytical and technical skills.
100%
Job Success
Mount Pleasant, United States - 5:39 am local time
Advanced financial modeling and visualization skills with Excel, Python, Power BI, PowerPoint, and Tableau. Proven ability to create customized and intuitive financial models and other professional services for any asset, project, business, or cash flow.
Steps for completing your project
After purchasing the project, send requirements so Gilles can start the project.
Delivery time starts when Gilles receives requirements from you.
Gilles works on your project following the steps below.
Revisions may occur after the delivery date.
Source and clean the data
Create the chart using Plotly library in Python