You will get I will build a custom Power BI dashboard for your business data
Project details
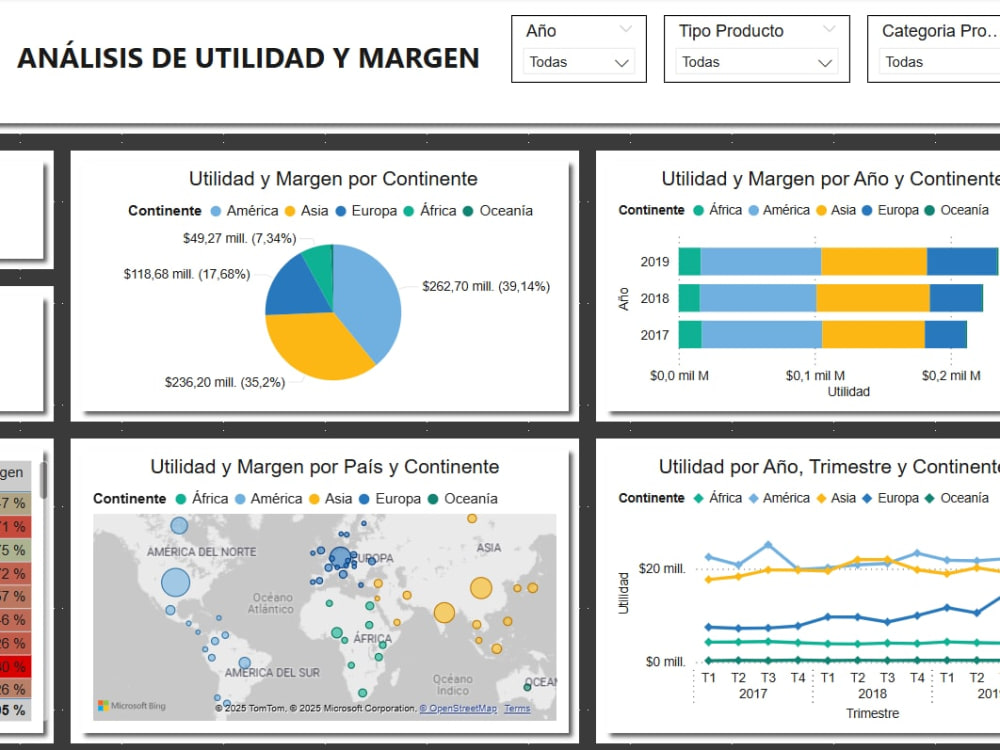
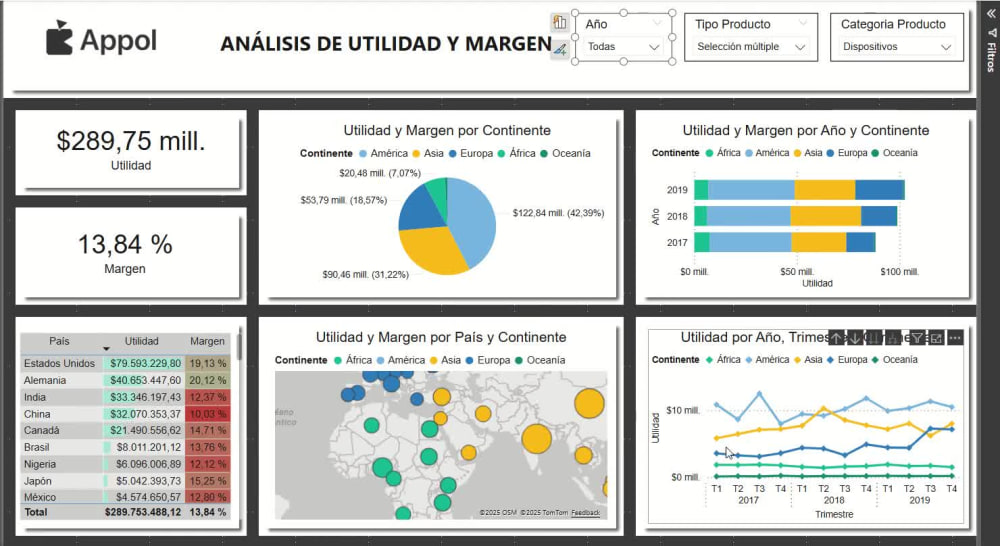
Are you struggling to make sense of your business data? I will create a dynamic, interactive Power BI dashboard that transforms your raw numbers into clear, actionable insights.
With 4+ years of experience in data analysis and visualization, I help businesses and entrepreneurs improve decision-making through professional dashboards.
Let’s turn your data into decisions 🚀
With 4+ years of experience in data analysis and visualization, I help businesses and entrepreneurs improve decision-making through professional dashboards.
Let’s turn your data into decisions 🚀
Database Type
MS AccessWhat's included
| Service Tiers |
Starter
$50
|
Standard
$100
|
Advanced
$150
|
|---|---|---|---|
| Delivery Time | 3 days | 4 days | 6 days |
Number of Revisions | 1 | 0 | 0 |
Source Code | - | - | - |
About Alejandra
Data & Process Analyst | Power BI & Excel Dashboards | Automation
Bogota, Colombia - 1:43 am local time
Hi! I’m Alejandra Padilla, an Industrial Engineer specialized in data analysis and process automation. I help businesses and entrepreneurs transform their data into clear, actionable dashboards using Power BI and Excel.
🔹 4+ years of experience in:
- Dashboards for KPIs and business intelligence
- Excel automation (macros, formulas, dynamic tables)
- Data cleaning and analysis
- Process documentation and operational support
Let’s work together to turn your data into decisions!
📩 contacto@datosenaccion.com | (+34) 604 83 16 38
Steps for completing your project
After purchasing the project, send requirements so Alejandra can start the project.
Delivery time starts when Alejandra receives requirements from you.
Alejandra works on your project following the steps below.
Revisions may occur after the delivery date.
STEP 1 – Requirement Collection
You send me the data (Excel, CSV, or sample file) and describe what you want to visualize or automate. I’ll also ask a few questions to clarify your goals and KPIs.
STEP 2 – Dashboard Design
I design the structure and create the initial version of the dashboard, including charts, filters, and key calculations.