You will get a Professional Dashboard From Your Data in Excel or Tableau
Project details
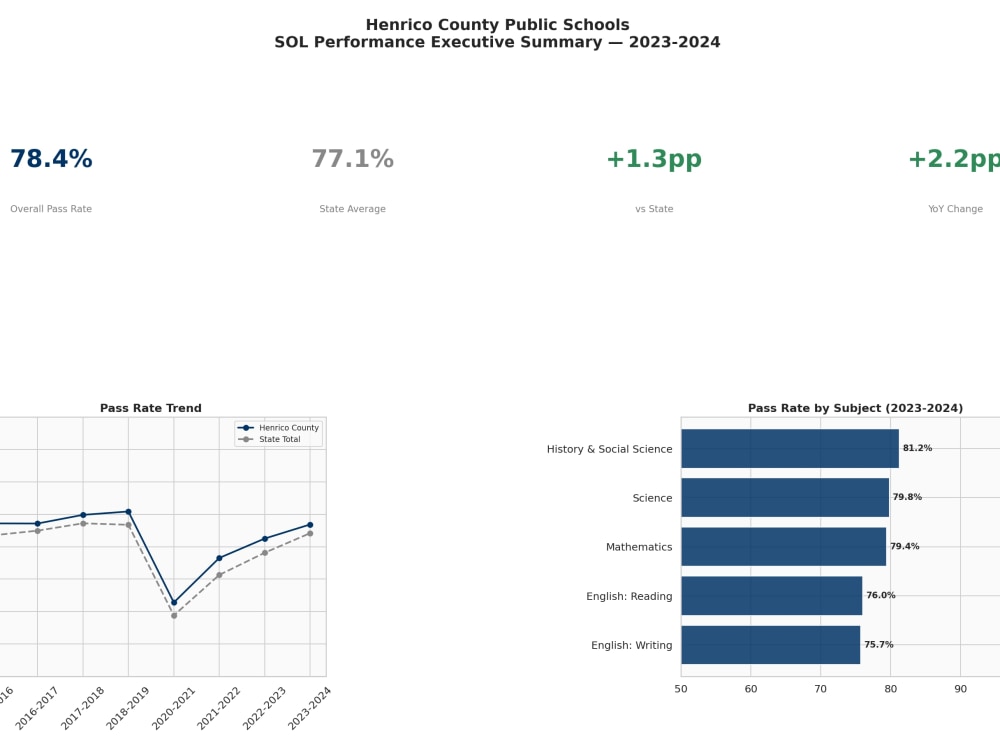
You'll get a clean, professional, interactive dashboard that turns your raw data into visual KPIs, trends, and comparisons your team can actually use. I'm a data analyst with an M.S. in Data Science from the University of Virginia and a B.S. in Data Analytics (3.98 GPA). I build dashboards in Excel (pivot tables, slicers, charts) and Tableau for clients who need to track sales, operations, HR metrics, program outcomes, or financial KPIs. Every dashboard includes a walkthrough so you know exactly how to read it and update it yourself. No clutter, no confusion, just the numbers that matter, presented clearly.
Database Type
MySQL, SQLite, PostgreSQLWhat's included
| Service Tiers |
Starter
$200
|
Standard
$400
|
Advanced
$750
|
|---|---|---|---|
| Delivery Time | 5 days | 7 days | 10 days |
Number of Revisions | 2 | 3 | 3 |
Source Code | - |
Frequently asked questions
About Elisa
Data Scientist & Data Analyst | Excel, Python, R, Tableau | Bilingual
Richmond, United States - 5:35 pm local time
I work across the full data lifecycle: cleaning and consolidating data, exploratory analysis, building models, and creating clear visualizations. In past projects I have cleaned and analyzed datasets ranging from a few hundred to over 20,000 records, built executive dashboards, and developed machine learning and NLP systems.
How I can help you:
• Excel & Google Sheets: advanced formulas, pivot tables, dashboards, data cleaning, multi-file matching and consolidation
• Data Analysis & Statistics: EDA, regression, hypothesis testing, survey analysis in Python and R
• Dashboards & Visualization: Tableau dashboards and clear charts for technical and non-technical audiences
• Machine Learning & AI: predictive modeling, classification, NLP, and model evaluation
I communicate clearly without unnecessary jargon, deliver accurate and well-documented work, and offer a short free consultation before you commit. I also work bilingually in English and Spanish.
Tell me what you are trying to accomplish, and I will tell you honestly whether I am the right fit and how I would approach it.
Steps for completing your project
After purchasing the project, send requirements so Elisa can start the project.
Delivery time starts when Elisa receives requirements from you.
Elisa works on your project following the steps below.
Revisions may occur after the delivery date.
Discovery
I review your data, confirm the KPIs you want to track, and send you a mockup layout for approval before building.
Build & Design
I build the full dashboard with charts, filters, KPI cards, and professional formatting tailored to your audience.