You will get "I will create Excel reports, charts, and pivot tables"
Project details
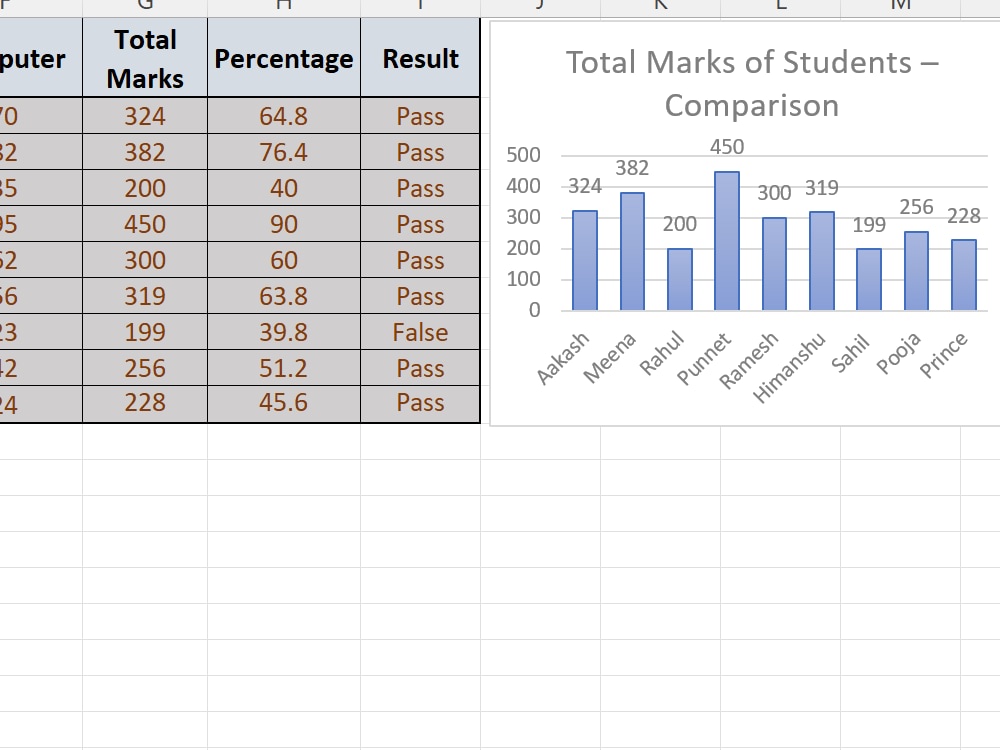
This Excel project demonstrates my skills in data entry, formulas, and chart creation. The project includes:
Entered marks of students for multiple subjects.
Calculated Total Marks and Percentage using SUM and formula-based calculations.
Determined Pass/Fail status using IF formula.
Created a Column Chart to visually compare students’ total marks.
Entered marks of students for multiple subjects.
Calculated Total Marks and Percentage using SUM and formula-based calculations.
Determined Pass/Fail status using IF formula.
Created a Column Chart to visually compare students’ total marks.
Data Tool
Microsoft ExcelWhat's included
| Service Tiers |
Starter
$5
|
Standard
$10
|
Advanced
$20
|
|---|---|---|---|
| Delivery Time | 1 day | 2 days | 4 days |
Number of Revisions | 1 | 2 | 3 |
About Himanshu
Excel specialist / Data Analyst
Ghaziabad, India - 6:07 pm local time
I am detail-oriented, accurate, and deliver results on time. I can help clients organize, analyze, and visualize their data efficiently. My goal is to provide professional, high-quality Excel solutions that save time and enhance decision-making.”
Steps for completing your project
After purchasing the project, send requirements so Himanshu can start the project.
Delivery time starts when Himanshu receives requirements from you.
Himanshu works on your project following the steps below.
Revisions may occur after the delivery date.
Data Entry
Enter student names and marks for all subjects.
Formulas
Calculate Total Marks using SUM formula. Calculate Percentage using formula (Total Marks / 500) * 100.