You will get Your Data Turned Into Publication-Quality Charts and Visuals
Project details
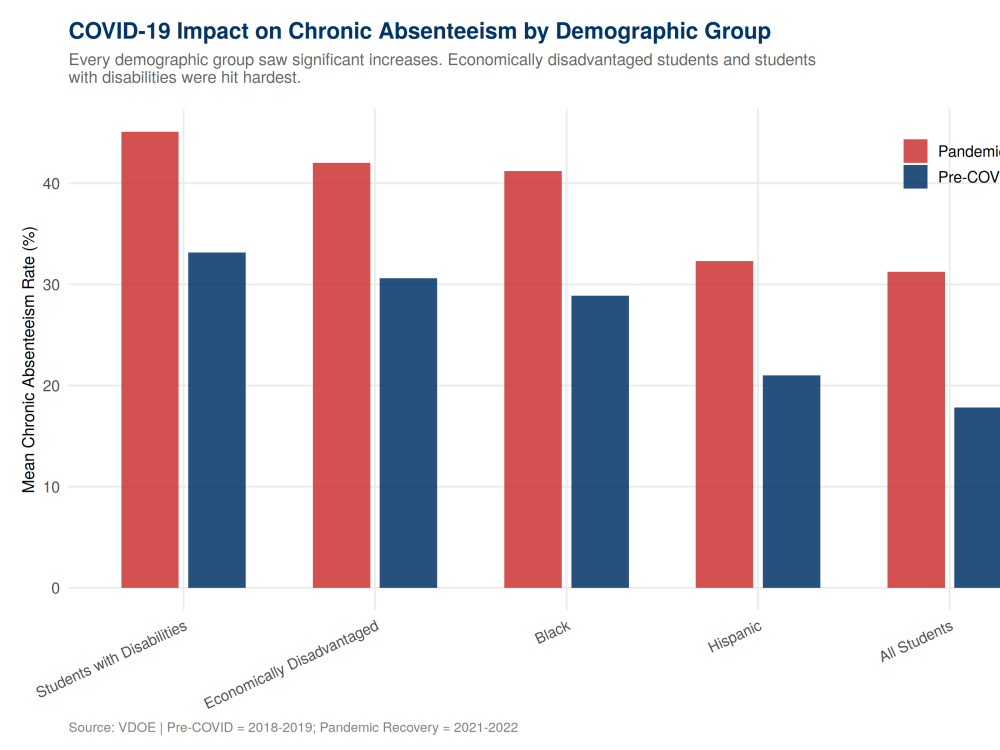
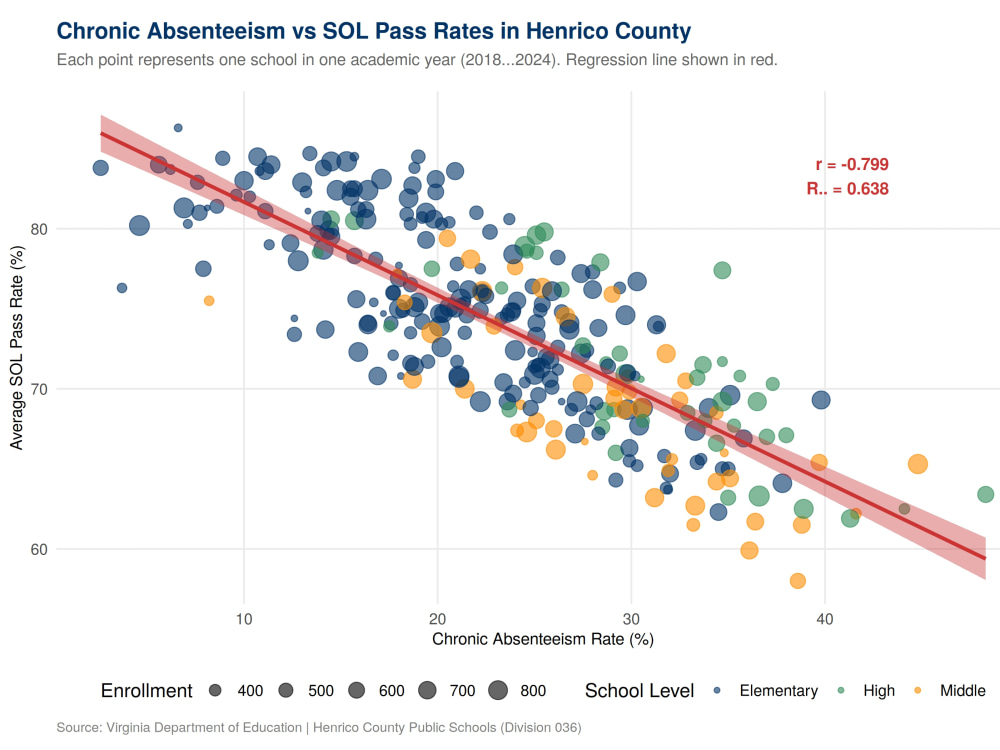
Ugly charts kill good data. I create clean, professional, publication-quality visualizations that tell your story clearly, whether it's for a board presentation, a grant report, a research paper, or a website. I'm a data analyst with an M.S. in Data Science (University of Virginia) and a B.S. in Data Analytics (3.98 GPA). I build charts using R (ggplot2), Python (matplotlib, seaborn, Plotly), Tableau, and Excel. Every chart gets proper axis labels, annotations, color schemes, and formatting designed for your specific audience. Delivered as high-resolution PNG, PDF, or SVG files ready for print or screen, plus source code so you can modify later. Bar charts, line charts, scatter plots, heatmaps, box plots, demographic comparisons, trend lines, and infographic-style summary panels.
Database Type
MySQL, SQLite, PostgreSQLWhat's included
| Service Tiers |
Starter
$100
|
Standard
$200
|
Advanced
$400
|
|---|---|---|---|
| Delivery Time | 3 days | 5 days | 7 days |
Number of Revisions | 2 | 2 | 3 |
Source Code | - |
Frequently asked questions
About Elisa
Data Scientist & Data Analyst | Excel, Python, R, Tableau | Bilingual
Richmond, United States - 2:10 pm local time
I work across the full data lifecycle: cleaning and consolidating data, exploratory analysis, building models, and creating clear visualizations. In past projects I have cleaned and analyzed datasets ranging from a few hundred to over 20,000 records, built executive dashboards, and developed machine learning and NLP systems.
How I can help you:
• Excel & Google Sheets: advanced formulas, pivot tables, dashboards, data cleaning, multi-file matching and consolidation
• Data Analysis & Statistics: EDA, regression, hypothesis testing, survey analysis in Python and R
• Dashboards & Visualization: Tableau dashboards and clear charts for technical and non-technical audiences
• Machine Learning & AI: predictive modeling, classification, NLP, and model evaluation
I communicate clearly without unnecessary jargon, deliver accurate and well-documented work, and offer a short free consultation before you commit. I also work bilingually in English and Spanish.
Tell me what you are trying to accomplish, and I will tell you honestly whether I am the right fit and how I would approach it.
Steps for completing your project
After purchasing the project, send requirements so Elisa can start the project.
Delivery time starts when Elisa receives requirements from you.
Elisa works on your project following the steps below.
Revisions may occur after the delivery date.
Data Review & Chart Plan
I review your data, identify the best chart types for your story, and send you a quick plan showing what I'll create.
Design & Build
I create all charts with professional formatting, proper labels, annotations, and your color preferences.