You will get Industry margin analysis visualization in power bi
Project details
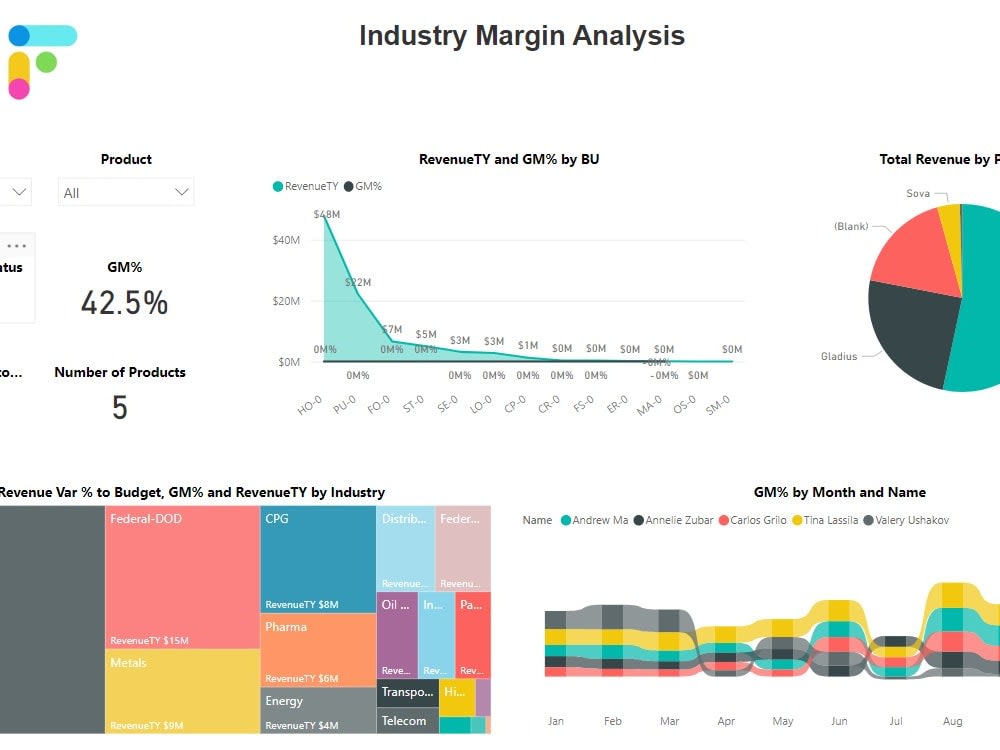
Industry Margin Analysis with Enhanced Filter Functionality and Key Performance Indicators (KPIs)
1. Filter Functionality:
The platform will include robust filter options, enabling users to dynamically customize their analysis based on specific criteria.
2. Key Performance Indicators (KPIs):
The Industry Margin Analysis tool will prominently feature a set of essential KPIs, ensuring that users can readily assess critical metrics that influence business performance.
3. Four Essential KPIs Display:
- Revenue: Offering an overview of the total revenue generated over a selected period.
- Gross Margin (GM) Percentage: Highlighting the relationship between revenue and cost of goods sold.
4. Revenue and GM Percentage Charts:
Through clear and visually engaging charts, the tool will visually represent revenue trends and GM percentages over time.
5. Revenue by Product - Pie Chart:
The Industry Margin Analysis will include a visually appealing pie chart showcasing revenue distribution by product. This visualization allows stakeholders to understand which products contribute significantly to revenue and make informed decisions regarding product portfolio management.
Data Tool
Microsoft Power BIWhat's included
| Service Tiers |
Starter
$9
|
Standard
$89
|
Advanced
$199
|
|---|---|---|---|
| Delivery Time | 2 days | 4 days | 7 days |
Number of Revisions | 1 | 2 | 3 |
Number of Graphs/Charts | 2 | 5 | 10 |
Number of Variations | 1 | 2 | 3 |
Data Source Connectivity | |||
Web Embedding | |||
Interactive/Animated Visuals | - |
Optional add-ons
You can add these on the next page.
Fast Delivery
+$9 - $149
Additional Graph/Chart
(+ 1 Day)
+$7About Aditya
Microsoft Certified Data Analyst | Business Intelligence & Web Develop
Ahmedabad, India - 7:48 pm local time
What I Do:
🌟 Data Analytics & AI/ML Expert:
Transform raw data into meaningful insights using Power BI, SQL, and more.
Develop complex AI and machine learning models to predict and influence outcomes.
Expertise in DAX, Power Query, and Tabular Editor for robust data models.
🌟 Power BI and Microsoft 365 Specialist:
End-to-end Power BI solutions: data extraction, cleaning, modeling, and visualization.
Comprehensive management of Power BI Service and Microsoft 365 tools.
Enhance workflow efficiency through Power Automate and intuitive interfaces.
🌟 Website Development Mastery:
Customized, responsive websites across WooCommerce, Shopify, and WordPress.
Skilled in HTML, CSS, JavaScript for dynamic, user-friendly sites.
SEO optimization to boost your online presence and drive conversions.
How I Work:
Planning: I begin with a thorough understanding of your goals and constraints, outlining a clear roadmap for success.
Communication: Regular updates and open lines of communication ensure we’re always aligned.
Execution: With precision and quality, I deliver on time, ensuring the final product meets your standards.
Post-Delivery: Comprehensive testing and documentation to provide you with a complete, user-friendly solution.
Why Choose Me?
I am committed to delivering secure, scalable, and sustainable solutions tailored to your business needs. Let’s work together to achieve your data goals and create impactful digital experiences.
📊 Reach out today, and let’s turn your vision into reality!
Steps for completing your project
After purchasing the project, send requirements so Aditya can start the project.
Delivery time starts when Aditya receives requirements from you.
Aditya works on your project following the steps below.
Revisions may occur after the delivery date.
1. Data Source and Preparation:
Import the dataset containing pertinent information concerning sales, returns, regional divisions, channel classifications, products, and other pertinent dimensions into the selected visualization platform.
2.KPI Section:
Incorporate an uppermost segment dedicated to the display of Key Performance Indicators (KPIs): Aggregate Sales Value Return Ratio (calculated as the Return Amount divided by Total Sales) Cumulative Return Amount