You will get Interactive and insightful dashboard in Microsoft Power BI
Project details
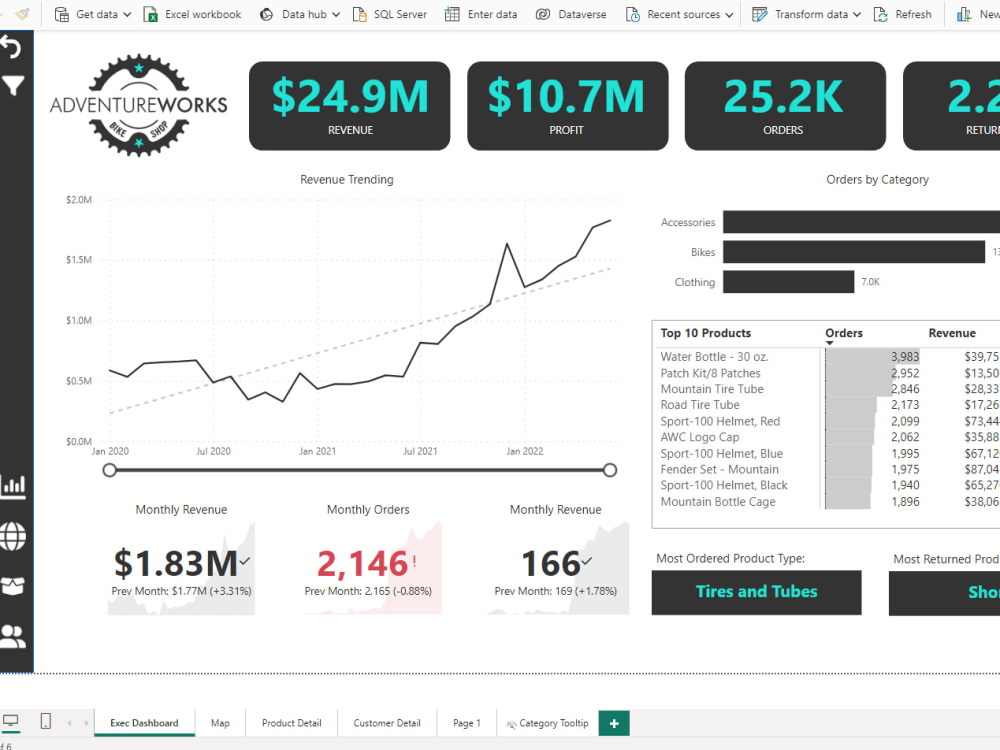
Our Power BI sales dashboard is designed to provide a comprehensive overview of key sales metrics and insights across four distinct sections.
The first section features an executive dashboard, offering summaries of critical performance indicators and provides executives with an at-a-glance understanding of overall sales performance.
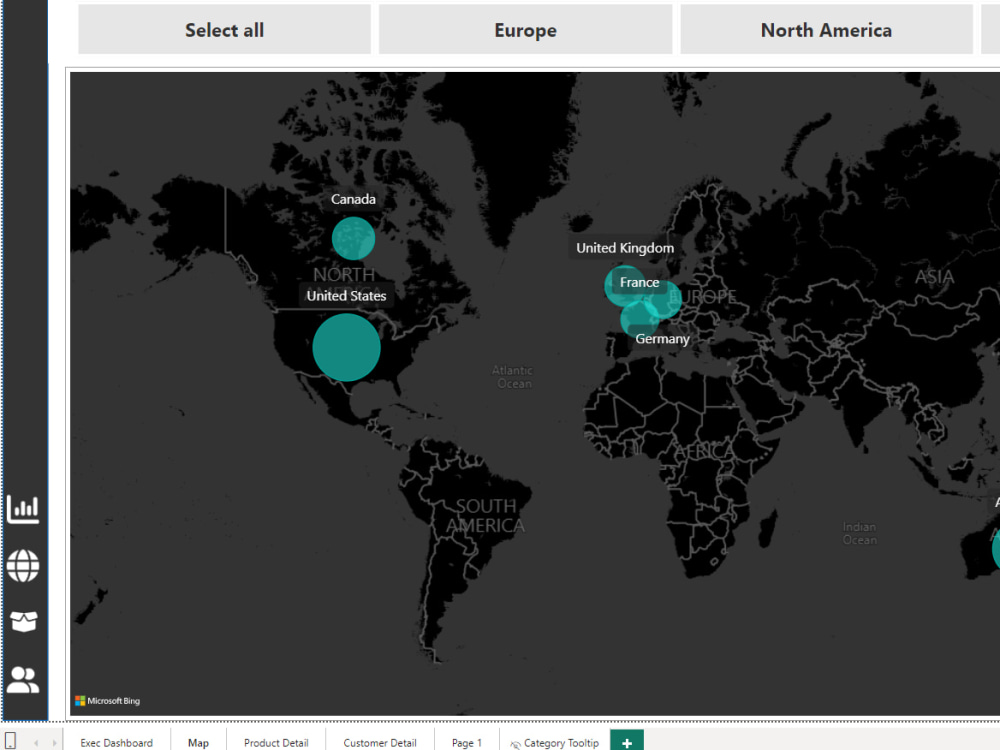
The section section focuses on geographic representation of sales data by region. This allows stakeholders to identify geographical areas of strength or opportunity and tailor their strategies accordingly.
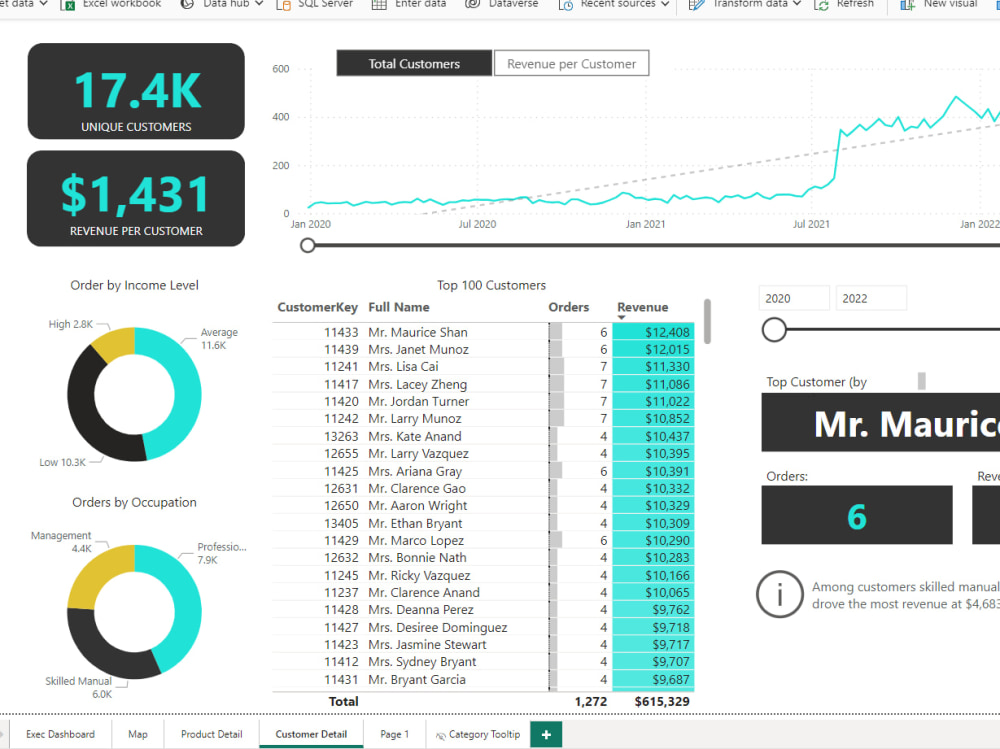
In the Third section, we delve into customer-specific details, presenting insights related to customer behavior, preferences, and engagement. This section enables deeper analysis of customer segments and facilitates targeted marketing efforts.
Lastly, the fifth section is dedicated to product-related insights, offering valuable information on product performance, trends, and profitability. This section empowers decision-makers to optimize product offerings strategies.
Our Power BI sales dashboard provides a platform for stakeholders to monitor sales , identify trends, and make informed decisions to drive business growth.
The first section features an executive dashboard, offering summaries of critical performance indicators and provides executives with an at-a-glance understanding of overall sales performance.
The section section focuses on geographic representation of sales data by region. This allows stakeholders to identify geographical areas of strength or opportunity and tailor their strategies accordingly.
In the Third section, we delve into customer-specific details, presenting insights related to customer behavior, preferences, and engagement. This section enables deeper analysis of customer segments and facilitates targeted marketing efforts.
Lastly, the fifth section is dedicated to product-related insights, offering valuable information on product performance, trends, and profitability. This section empowers decision-makers to optimize product offerings strategies.
Our Power BI sales dashboard provides a platform for stakeholders to monitor sales , identify trends, and make informed decisions to drive business growth.
Data Tool
Microsoft Power BIWhat's included
| Service Tiers |
Starter
$50
|
Standard
$150
|
Advanced
$400
|
|---|---|---|---|
| Delivery Time | 2 days | 3 days | 5 days |
Number of Revisions | 0 | 1 | 2 |
Number of Graphs/Charts | 3 | 6 | 9 |
Number of Variations | 2 | 4 | 6 |
Data Source Connectivity | |||
Web Embedding | - | - | |
Interactive/Animated Visuals | - |
8 reviews
(8)
(0)
(0)
(0)
(0)
This project doesn't have any reviews.
HG
Hugh G.
Apr 13, 2024
PostgreSQL Consultant Needed
Saqib was very well organized, able to assess what was needed and worked efficiently whether we were working together over the internet or he was working independently. Saqib is very experienced with data architecture and database management. His knowledge and "how to" are impressive. In addition he has a good feel for IT generally and is enthusiastic both about sharing what he knows and learning new things too. Saqib communicates well. He asked insightful questions throughout our work together, the kind of questions that not only helped clarify what was needed but illuminated previously unconsidered ways we could proceed. Putting this all together, Saqib is a pleasure to work with, is practical and thinks ahead.
Having completed the first phase of our work together, we will definitely be working together on the next.
Having completed the first phase of our work together, we will definitely be working together on the next.
AC
Aramanxy C.
Oct 6, 2023
Write a python script that extracts/downloads existing salesforce reports as csv files to a local
I cannot express how grateful I am for the exceptional work that Saqib delivered on my project. From start to finish, this experience has been nothing short of amazing.
Saqib not only met the project requirements but exceeded them in every way imaginable. His attention to detail, creativity, and dedication to delivering high-quality results were truly remarkable. What initially seemed like a challenging task turned into an outstanding piece of work, all thanks his expertise.
He consistently communicated updates, offered valuable suggestions, and worked tirelessly to ensure the project’s success. He demonstrated a level of professionalism and commitment that is rare to find.
Thank you, Saqib for going above and beyond and making this project a resounding success. I look forward to collaborating again in the future.
AM
Alieu M.
Sep 29, 2023
Data Engineer for ETL required
He is a very knowledgeable data engineer and was able to perform our task efficiently and successfully with no issues. I will highly recommend him.
JG
Jeff G.
Feb 27, 2023
Tableau Development
Saqib did an absolutely tremendous job, he far exceeded my expectations, and I am extremely grateful for the work he did, fully self-directed, with commensurate knowledge to complete the project at a very high level of quality. I look forward to working with Saqib again in the future!
FM
Farayi M.
May 20, 2022
Create an interactive dashboard in excel
About Saqib
Data Analyst & Visualization Expert - Power BI, Google Sheets, Excel
100%
Job Success
Islamabad, Pakistan - 10:27 pm local time
Drawing upon over a decade of expertise, I specialize in harnessing the power of data through insightful visualization and dynamic dashboard/report creation using Microsoft Power BI, Excel and Google Sheets. With a meticulous focus on optimizing business intelligence, I enrich, organize, and integrate diverse data sources to empower clients in making strategic decisions that drive commercial success.
My proficiency extends across various domains, encompassing business operations, data warehousing, and analytics tools, coupled with a creative problem-solving approach to ensure data efficacy.
💡 Are you seeking to streamline your data processes and unlock actionable insights through intuitive visualizations? Do you aspire to leverage the full potential of your data to make informed decisions swiftly and efficiently? Look no further; I'm here to assist!
𝗪𝗲 𝗺𝗮𝘆 𝗯𝗲 𝗴𝗿𝗲𝗮𝘁 𝗳𝗶𝘁 𝗶𝗳 𝘆𝗼𝘂 𝘄𝗮𝗻𝘁 𝘁𝗼:
✅ Transforming raw data into meaningful insights through visually compelling dashboards using Microsoft Power BI.
✅ Automating data processes to optimize efficiency and focus on driving business value.
✅ Integrate and streamline and consolidate your data from various sources into a centralized location, ensuring proper formatting, structure, and data model alignment.
✅ Providing expert guidance and support to navigate complex data challenges and extract actionable insights.
𝗠𝘆 𝗔𝗿𝗲𝗮𝘀 𝗼𝗳 𝗘𝘅𝗽𝗲𝗿𝘁𝗶𝘀𝗲:
✔️ Data Visualization Tools: Microsoft Power BI - Microsoft Excel - Google Sheet - SQL - Python
✔️ Data Modeling: Python - SQL - Microsoft Power BI
✔️ Automation and Integration: Python - SQL
✔ Geo- visualization: Maps
✔ Microsoft Excel: VBA - Pivot Charts - Macro
✔ Data Analysis: Digital Products - Financial - Sales & Distribution - Marketing with Dashboards
✔ Languages: Microsoft Power Query - DAX - SQL - Python
📊 Thank you for considering my profile. I eagerly anticipate the opportunity to collaborate with you and drive actionable insights from your data with the unparalleled capabilities of Excel, Google Sheets, Microsoft Power BI and DAX.
Steps for completing your project
After purchasing the project, send requirements so Saqib can start the project.
Delivery time starts when Saqib receives requirements from you.
Saqib works on your project following the steps below.
Revisions may occur after the delivery date.
Connect Data Sources
In this phase, I'll establish connections to data sources, rigorously validate the data, and meticulously carry out data formatting and cleansing procedures.
Data Engineering and Data Model Creation
In this pivotal phase, I'll craft the foundational data model and execute subsequent transformations. Moreover, intricate data engineering tasks such as measure creation and column alterations will be meticulously handled here.