You will get Interactive Power BI and Looker Studio Dashboard
Top Rated


Project details
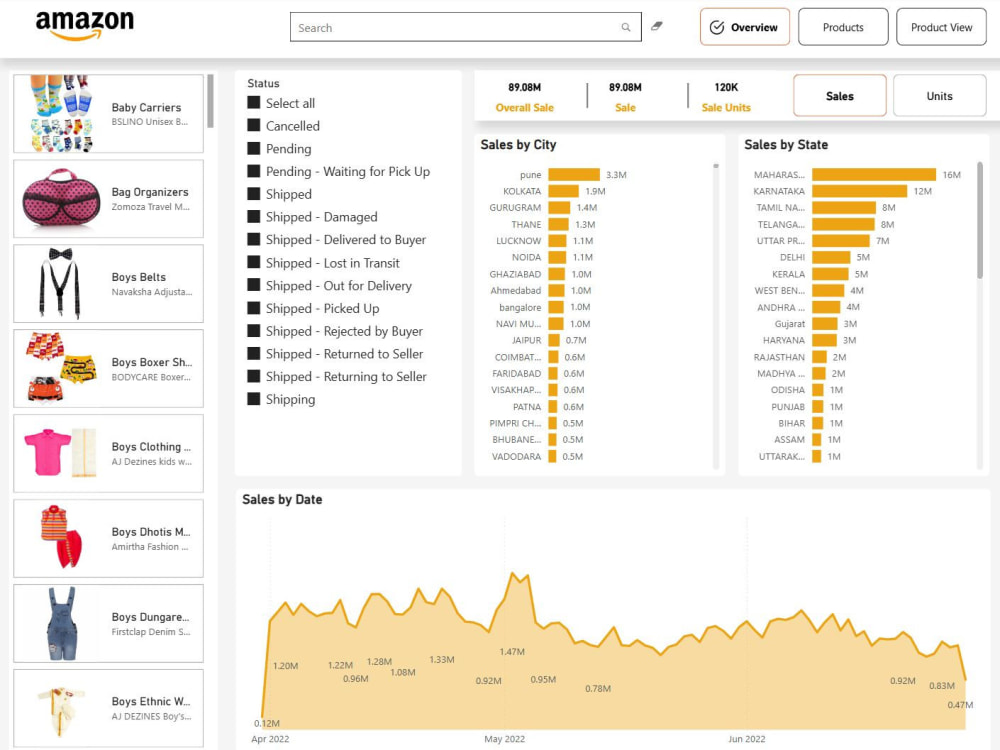
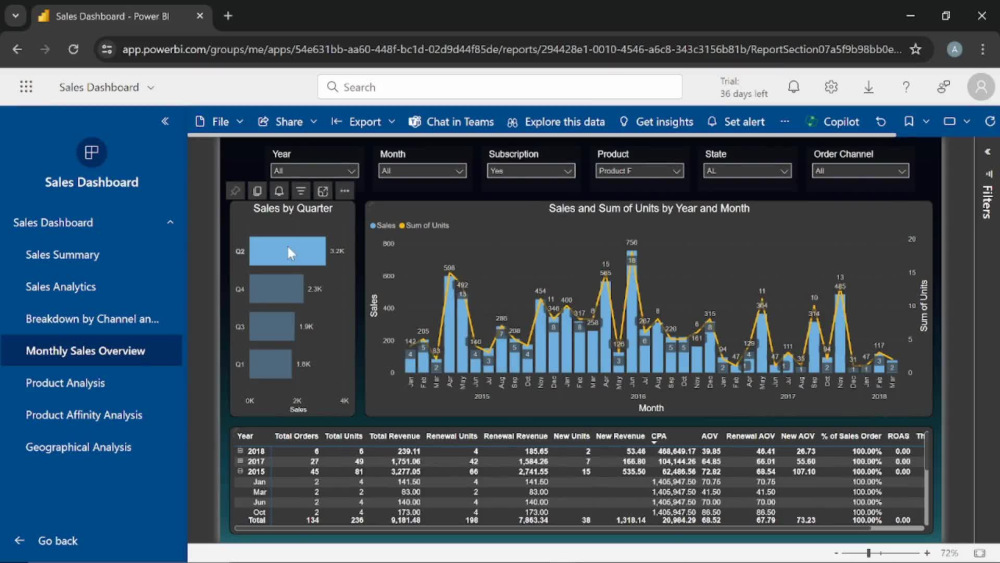
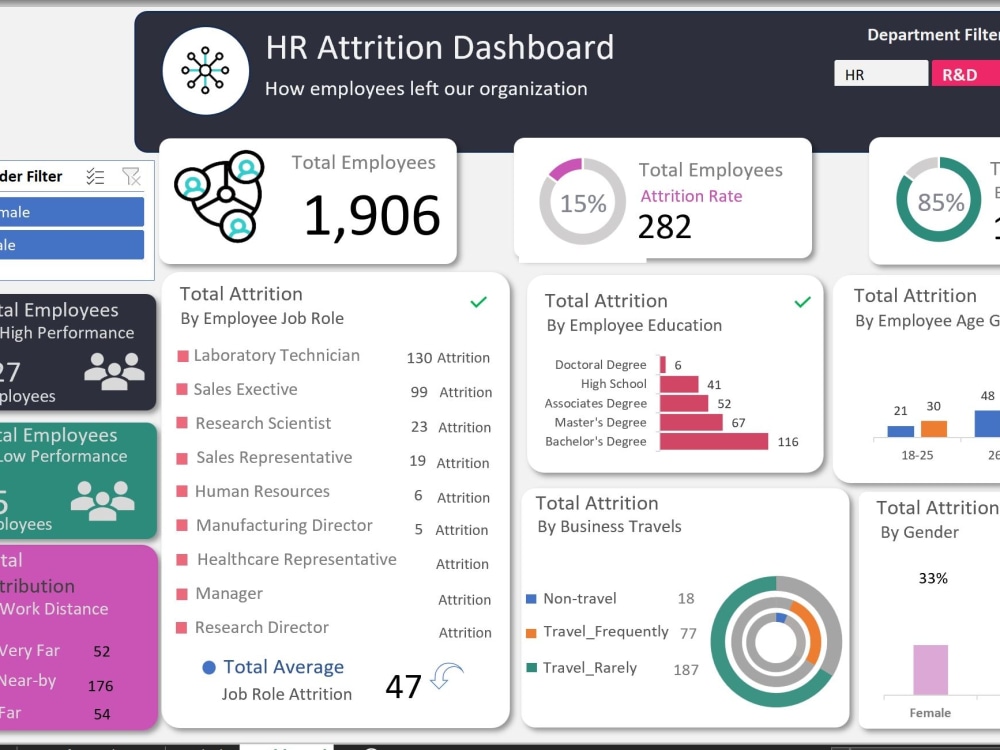
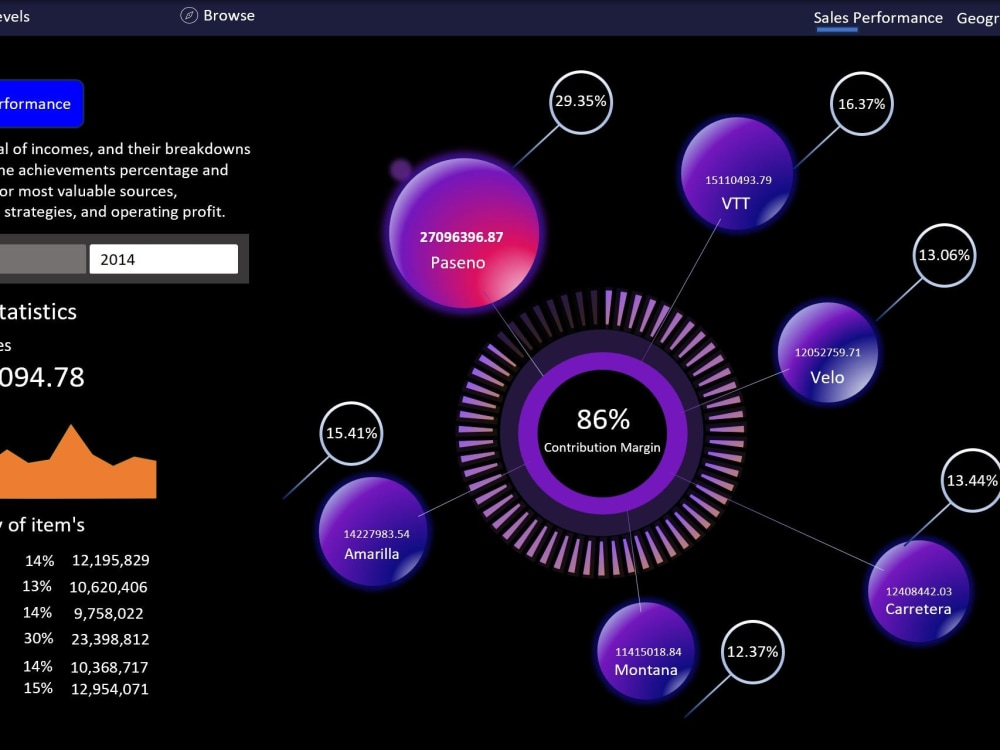
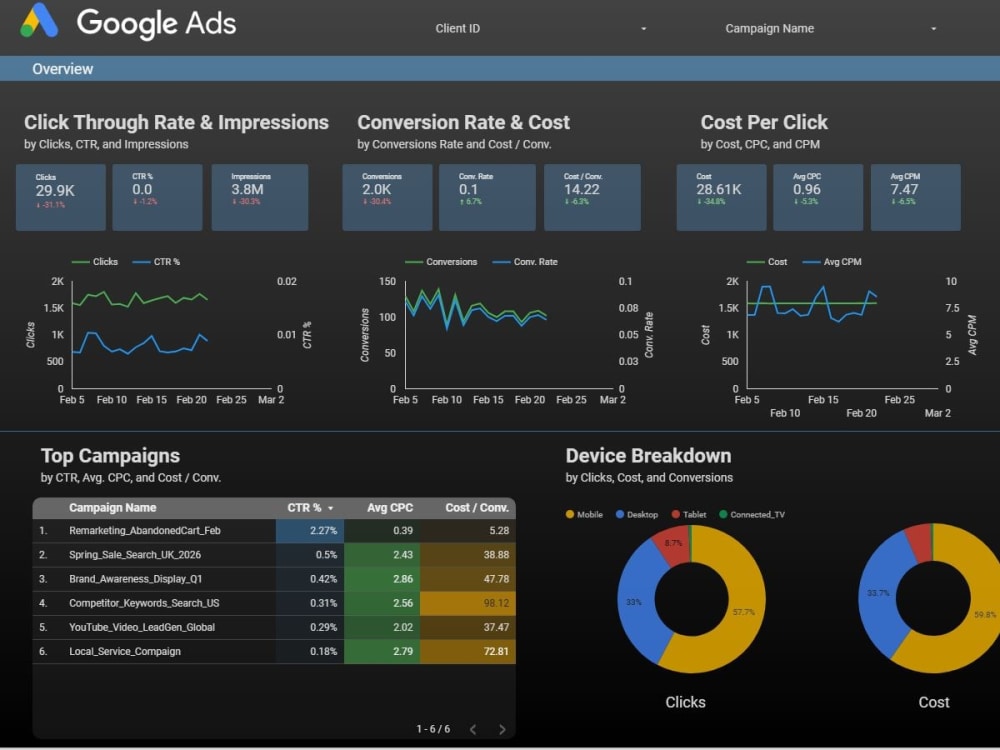
Build clear, interactive dashboards with Power BI and Looker Studio that turn your raw data into actionable insights. I create professional reports that connect to sources like Excel, Google Sheets, APIs, databases, and marketing platforms, transforming messy data into structured datasets and intuitive visualizations.
This service is ideal for businesses and teams that need reliable reporting without complex enterprise tools. I handle the full process — data cleaning, transformation, data modeling, DAX calculations, and dashboard design — delivering reports that are easy to understand and ready for decision-making.
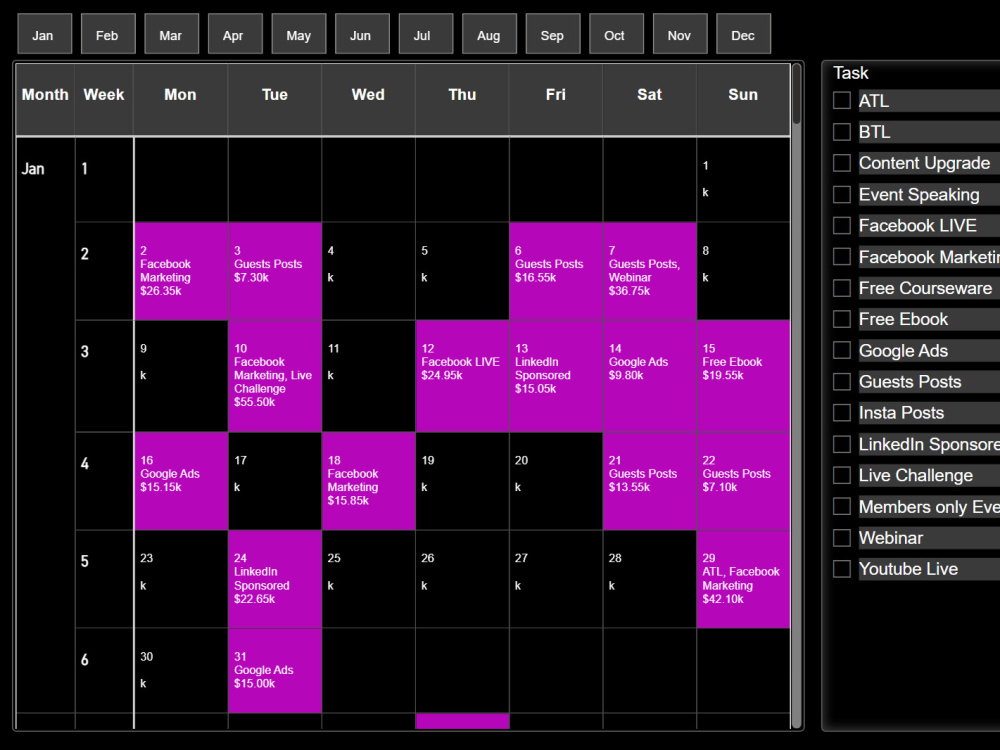
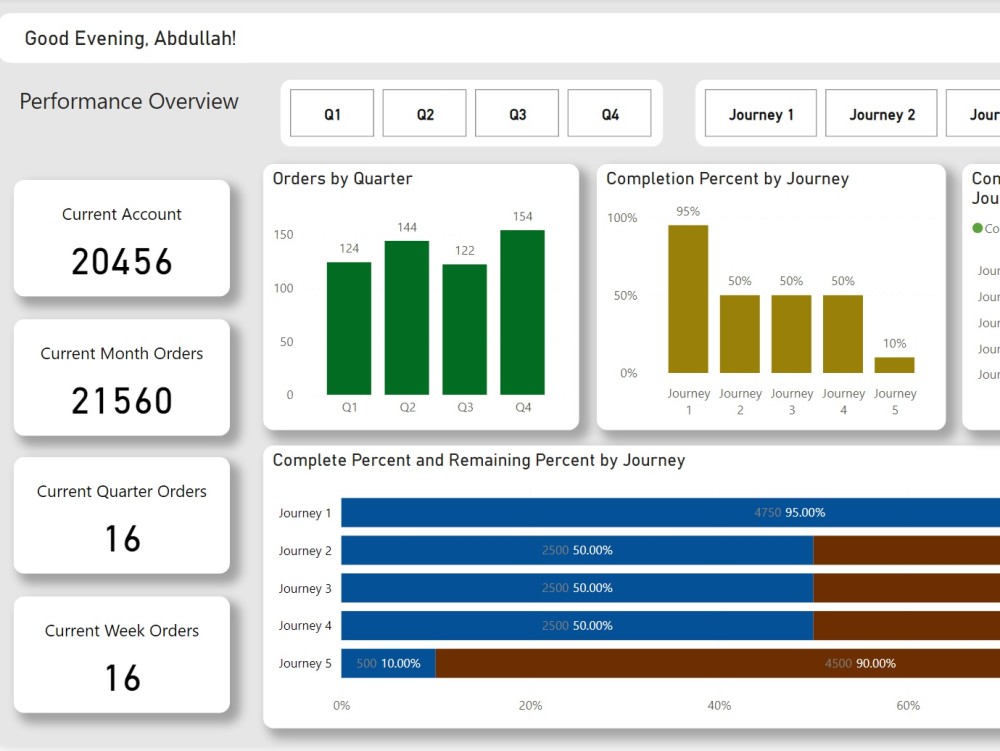
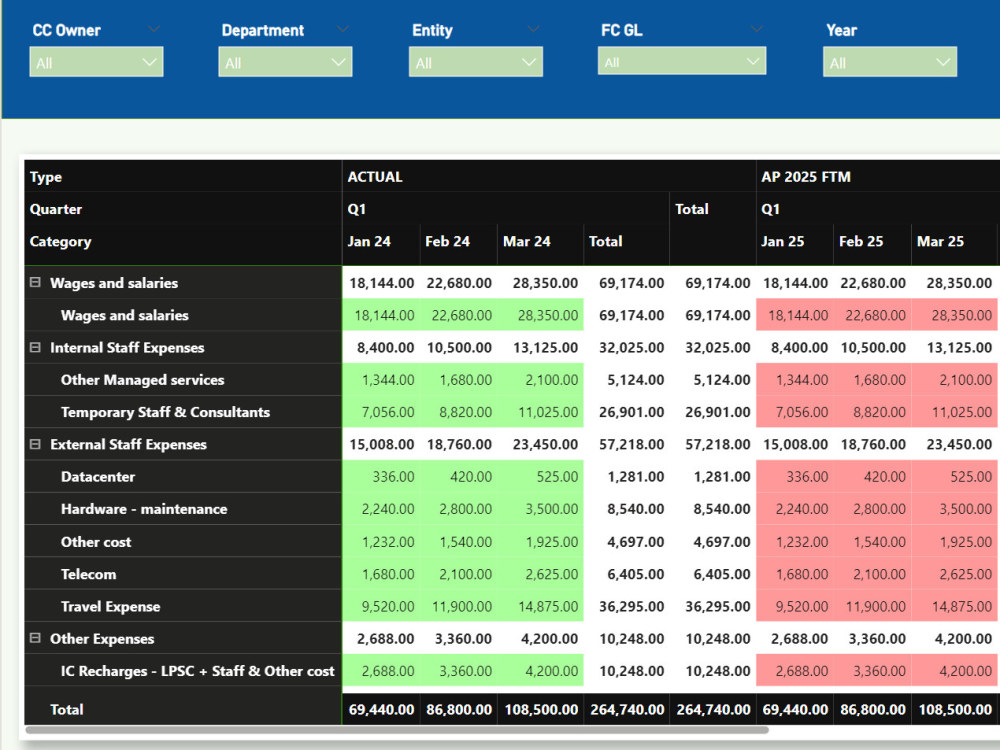
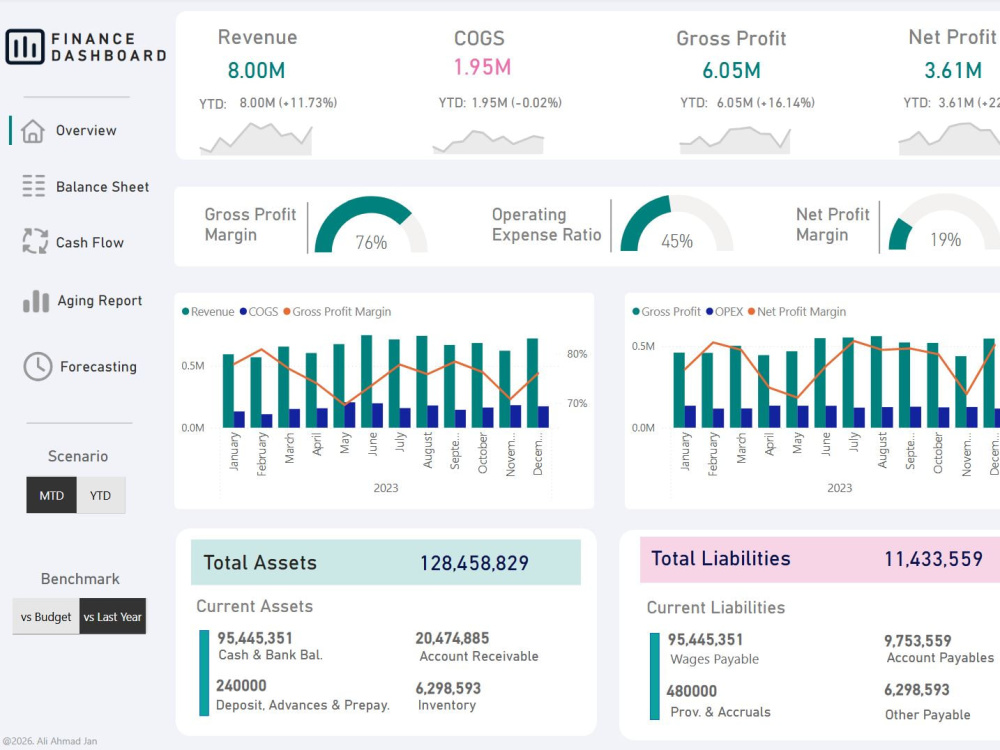
Dashboards can include KPI tracking, sales analysis, marketing performance, financial reporting, and operational insights, all built with interactive filters and drill-downs.
Benefits: Reduce manual reporting, improve visibility across your business, and make faster data-driven decisions. Each dashboard is tailored to your metrics and workflow, ensuring practical and scalable reporting.
Optional enhancements include data automation, API integrations, and scheduled refresh setups to keep your dashboards accurate and up to date.
This service is ideal for businesses and teams that need reliable reporting without complex enterprise tools. I handle the full process — data cleaning, transformation, data modeling, DAX calculations, and dashboard design — delivering reports that are easy to understand and ready for decision-making.
Dashboards can include KPI tracking, sales analysis, marketing performance, financial reporting, and operational insights, all built with interactive filters and drill-downs.
Benefits: Reduce manual reporting, improve visibility across your business, and make faster data-driven decisions. Each dashboard is tailored to your metrics and workflow, ensuring practical and scalable reporting.
Optional enhancements include data automation, API integrations, and scheduled refresh setups to keep your dashboards accurate and up to date.
Data Tool
Microsoft Power BIWhat's included
| Service Tiers |
Starter
$20
|
Standard
$50
|
Advanced
$100
|
|---|---|---|---|
| Delivery Time | 1 day | 2 days | 3 days |
Number of Revisions | 2 | 2 | 2 |
Number of Graphs/Charts | 4 | 6 | 12 |
Number of Variations | 2 | 2 | 2 |
Data Source Connectivity | - | ||
Web Embedding | - | - | |
Interactive/Animated Visuals |
Optional add-ons
You can add these on the next page.
Fast Delivery
+$30 - $50
99 reviews
(90)
(7)
(0)
(2)
(0)
This project doesn't have any reviews.
CP
Cuppalife P.
Jun 22, 2026
Project analysis work
On time delivery with detail write out.
NK
Nurettin K.
Jun 6, 2026
MCP Server For Claude Desktop
I have very good experiences with Ali. He conncected my Claude with Google ads. very good. Thank you very much for your support.
ML
Manoela L.
May 28, 2026
Power BI report
Clear communication, prompt responses, and smooth collaboration. Would gladly work together again.
YH
Yoseph H.
May 23, 2026
PowerBI Creation - Updating graphs and vizualizations
YH
Yoseph H.
May 13, 2026
value tracker KPI
About Ali
Power BI Consultant | Data Visualization Expert | Excel Specialist
100%
Job Success
Islamabad, Pakistan - 6:21 pm local time
With a background in mathematics and data science, I translate business questions into measurable metrics and design clean, audience-focused dashboards in Power BI and Looker Studio. My goal isn’t just to make dashboards look good — it’s to make them work. Each report highlights the trends, risks, and opportunities that matter, with clear KPIs, thoughtful layouts, and intuitive interactions so stakeholders can act without digging through raw data. I also deliver concise documentation and walkthroughs so your team can maintain and scale the solution.
What I Specialize In
Power BI Development & Dashboards
☑️Interactive dashboards with KPI tracking
☑️ Data modeling, DAX calculations & ETL processes
☑️ Real-time data connections via API integrations
☑️ Cross-platform deployment (web & mobile)
☑️ Power Automate for automated reporting workflows
Excel & Looker Studio
☑️ Advanced formulas, pivot tables & VBA automation
☑️ Marketing & performance dashboards in Looker Studio
☑️ Google Analytics, BigQuery & Google Sheets integrations
☑️ Real-time performance monitoring & reporting
Data Analytics & Reporting
☑️ Financial reporting, sales analytics & market research
☑️ Stock market & capital markets data analysis
☑️ Digital marketing performance tracking
☑️ Survey data analysis & visualization
Python & AI Automation
A big part of my work lately has been helping clients stop doing manually what a script can handle automatically. I use Python to automate data cleaning, build forecasting models, and set up workflows that save hours every week.
☑️ Automated data cleaning & preprocessing pipelines
☑️ Machine learning models for forecasting & pattern recognition
☑️ AI-powered workflows to eliminate repetitive manual tasks
☑️ End-to-end Python scripting for data transformation
If there's a repetitive data task eating up your team's time, there's a good chance I can fix that.
My Background:
I am a Certified Microsoft Power BI Data Analyst. I studied Mathematics at university, which provided me with a strong foundation in statistical thinking — a skill I find valuable in my work every day. Since then, I've collaborated with clients through platforms like Upwork, building a proven track record of delivering results across a wide array of industries and data challenges.
If you have data that isn’t providing the insights you need, I would love to help change that. Feel free to reach out; I’m happy to discuss your current challenges before we commit to anything.
Best,
Ali Ahmad Jan
Steps for completing your project
After purchasing the project, send requirements so Ali can start the project.
Delivery time starts when Ali receives requirements from you.
Ali works on your project following the steps below.
Revisions may occur after the delivery date.
ETL
Extract, Transform, and Load the Data into Power BI.
KPI and Metric Selection
Identify key performance indicators.