You will get interactive data visualization in d3
Top Rated

Project details
For the past 8 years, I have been working with D3.js, which is a tool for creating data visualizations. I have expertise in various D3 features like Force, Gantt, Map, Tree, and other graph types. I can create animated timelines with either static or dynamic data. I use Custom SVG along with frontend frameworks like React, Vue, or Angular.
My services come in different packages:
Basic Package (Choose one of the following types):
Sunburst
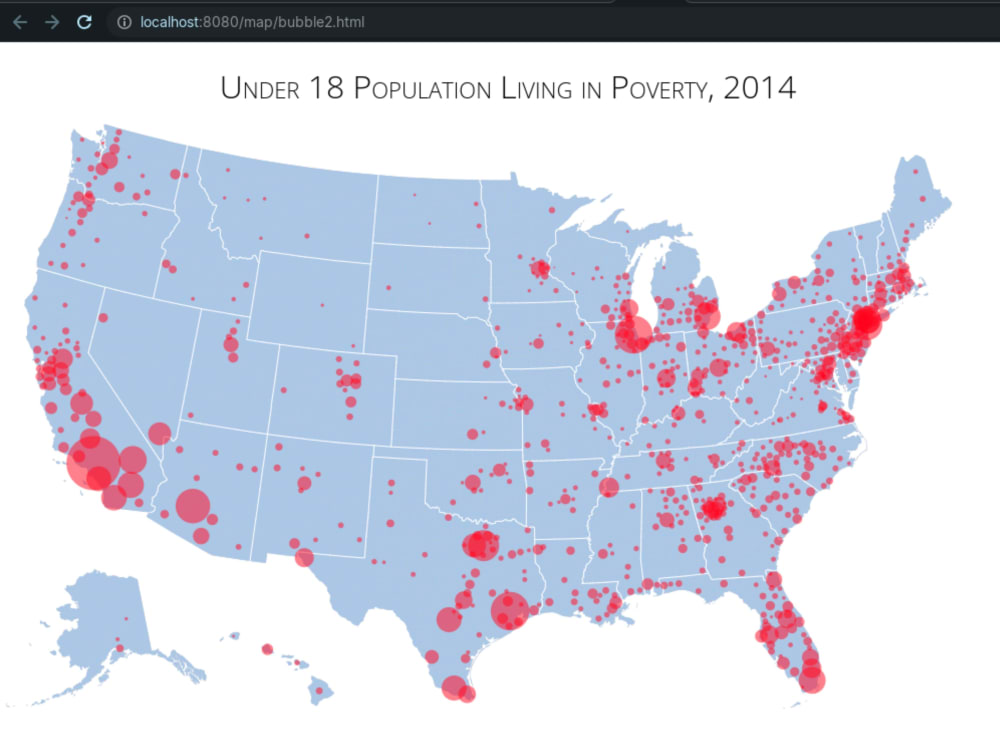
Map
Gantt
Tree
Pie Chart
Donut Chart
Polar Chart
Silver Package (Choose one of the following animated timelines):
Force Detected Graph
Bar Chart Race Animation
Timeline Chart
HeatMap Chart
Bubble Chart Animation
Gold Package:
Arc Diagram
Network Diagram
Animated Spikes
Feel free to reach out if you need any data visualization services.
My services come in different packages:
Basic Package (Choose one of the following types):
Sunburst
Map
Gantt
Tree
Pie Chart
Donut Chart
Polar Chart
Silver Package (Choose one of the following animated timelines):
Force Detected Graph
Bar Chart Race Animation
Timeline Chart
HeatMap Chart
Bubble Chart Animation
Gold Package:
Arc Diagram
Network Diagram
Animated Spikes
Feel free to reach out if you need any data visualization services.
What's included
| Service Tiers |
Starter
$30
|
Standard
$100
|
Advanced
$200
|
|---|---|---|---|
| Delivery Time | 2 days | 5 days | 7 days |
Number of Revisions | 2 | Unlimited | Unlimited |
Number of Graphs/Charts | 1 | 2 | 5 |
Number of Variations | 2 | 5 | 5 |
Data Source Connectivity | |||
Web Embedding | - | ||
Interactive/Animated Visuals | - |
29 reviews
(25)
(3)
(1)
(0)
(0)
This project doesn't have any reviews.
MW
Michael W.
Dec 30, 2025
Front-End Developer for D3.js Financial Charting System
Good experience.
ME
Mehmet E.
Dec 24, 2025
3d visualisation in web
DS
Dominik S.
Nov 22, 2025
Three.js and paper.js modification in existing project
WD
Wilson D.
Dec 12, 2024
Interactive Visualizer Developer(WebGPU)
AL
Altegon L.
Oct 30, 2024
Help with D3.js Chart to Display Future Predictions Correctly
Our customer was struggling from quite some time with his existing charts. We onboard the Masum and he perfectly found the bug and fix the issue quickly. Recommend him for any work related to data visualization with D3JS
About Masum
Advance Three.js, R3F & D3.js Expert | WebGL, WebGPU | React Frontend
100%
Job Success
Dhaka, Bangladesh - 5:04 pm local time
Technical Skills:
- Create 2D to 3D conversions, UV mapping, and custom shader effects
- Build real-time 3D graphics with WebGL, WebGPU, and Three.js
- Develop data visualizations with D3 for dashboards, analytics, and storytelling
- Design interactive product configurators and 3D model viewers
- Build cross-platform apps with React, Vue, Angular, and React Native
- Strong math skills: trigonometry, calculus, statistics, linear regression
- Advanced in JavaScript (ES6+), TypeScript, and modern frameworks
- Web graphics: Three.js, WebGL, WebGPU, Shaders (GLSL), UV mapping
- Data handling: JSON, XML, APIs, REST
- State management with Redux
- Latest testing tools: Jest, Cypress, Playwright, Mocha, Jasmine, Karma
- Version control with Git/GitHub
- Agile workflow: Scrum, CI/CD pipelines
Steps for completing your project
After purchasing the project, send requirements so Masum can start the project.
Delivery time starts when Masum receives requirements from you.
Masum works on your project following the steps below.
Revisions may occur after the delivery date.
Initial demo
I'll provide the initial demo with the custom dataset you provided