You will get Interactive Power BI dashboard with DAX and data modeling
Project details
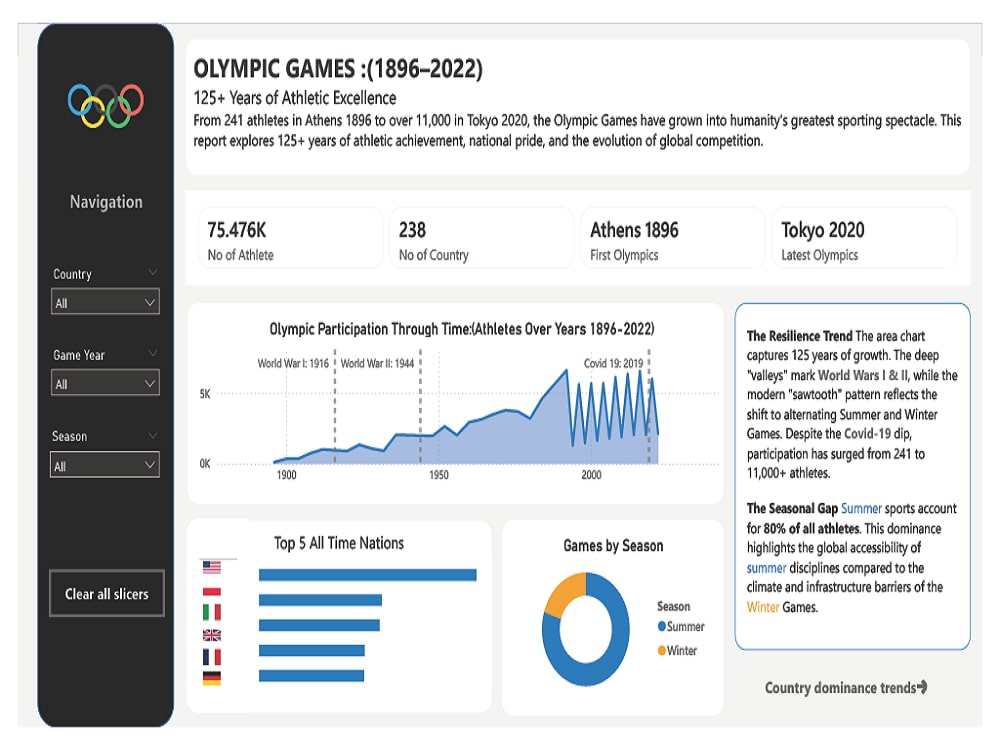
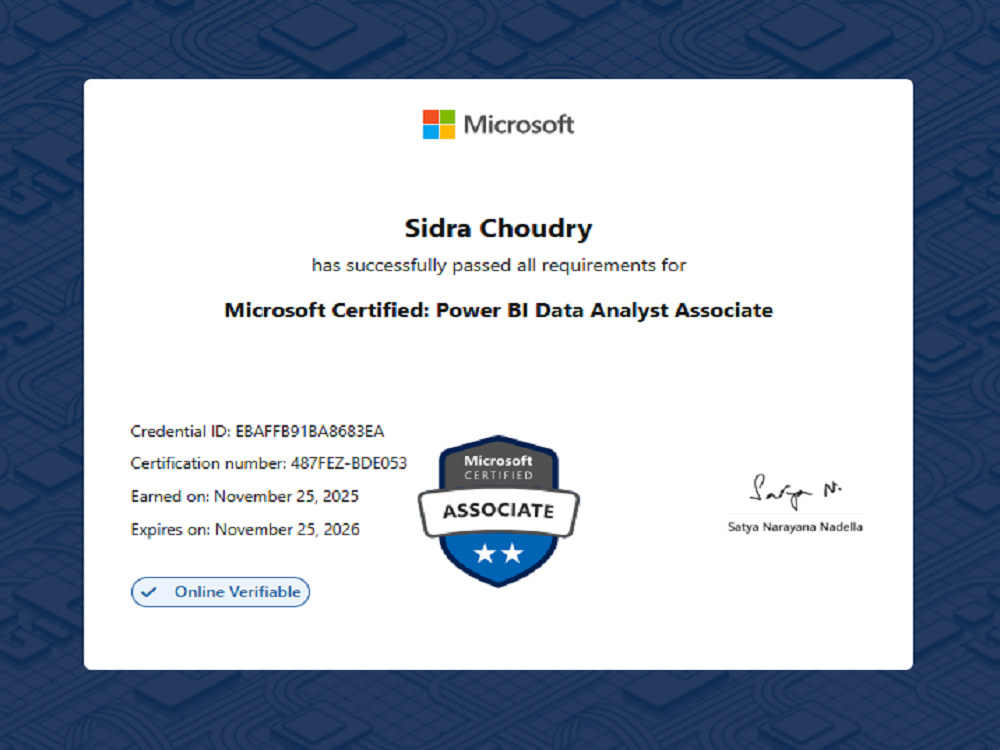
Are you drowning in data but starving for insights? As a Microsoft PL-300 Certified Power BI Developer, I turn your raw data into stunning, interactive dashboards that help you make smarter business decisions — fast.
Whether you're a startup tracking KPIs or an enterprise managing complex reporting, I deliver clean, professional dashboards built to impress.
✅ What You Get:
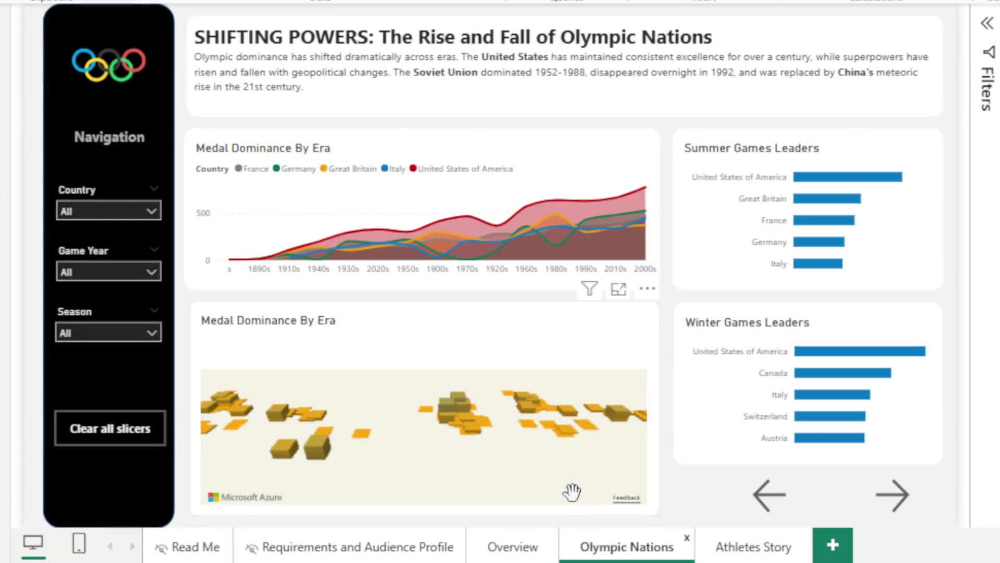
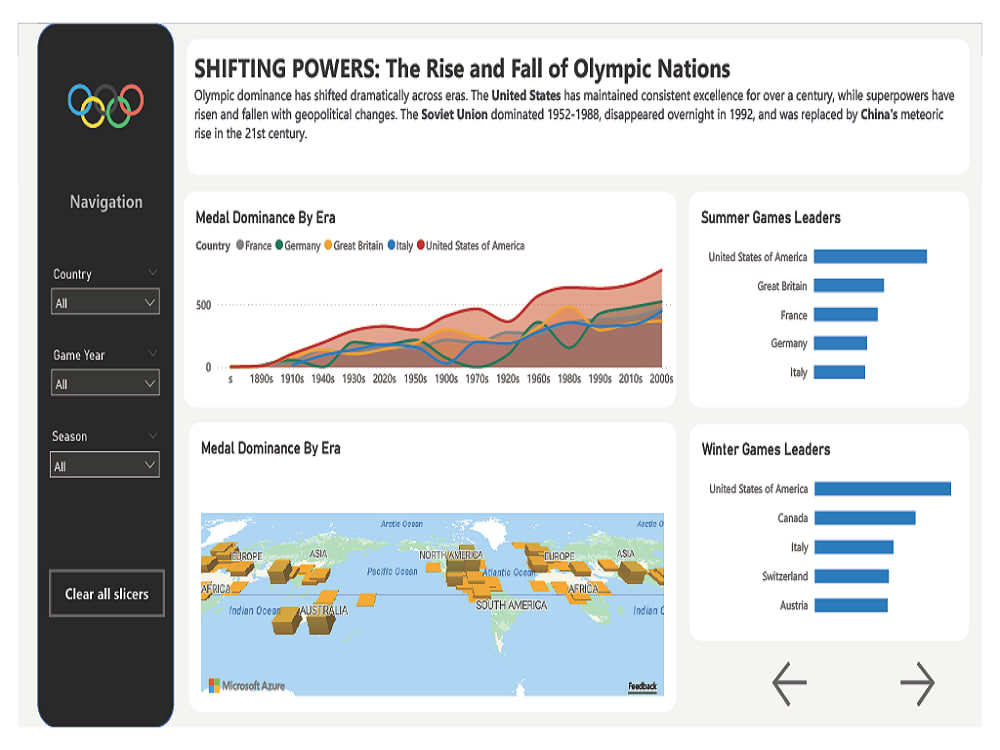
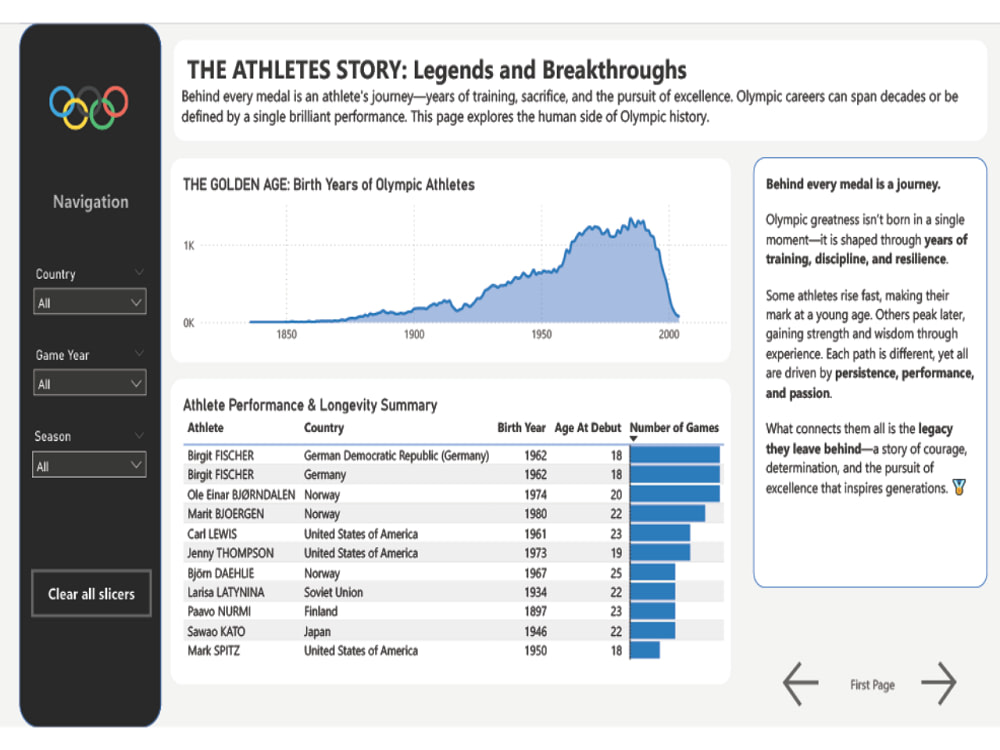
Custom interactive Power BI dashboard
DAX measures and calculated columns
Data modeling and relationship setup
Slicers, filters, and drill-through pages
Clean, branded visual design
Mobile-optimized layout
📊 I Work With Data From:
Excel · SQL Server · SharePoint · Google Sheets · Salesforce · MySQL · CSV files
🏆 Why Choose Me:
I hold the official Microsoft PL-300 certification — meaning I don't just build dashboards, I build them the right way. Every report follows Microsoft best practices for performance and scalability.
📩 Message me before ordering so I can understand your exact needs and guarantee a perfect result.
Whether you're a startup tracking KPIs or an enterprise managing complex reporting, I deliver clean, professional dashboards built to impress.
✅ What You Get:
Custom interactive Power BI dashboard
DAX measures and calculated columns
Data modeling and relationship setup
Slicers, filters, and drill-through pages
Clean, branded visual design
Mobile-optimized layout
📊 I Work With Data From:
Excel · SQL Server · SharePoint · Google Sheets · Salesforce · MySQL · CSV files
🏆 Why Choose Me:
I hold the official Microsoft PL-300 certification — meaning I don't just build dashboards, I build them the right way. Every report follows Microsoft best practices for performance and scalability.
📩 Message me before ordering so I can understand your exact needs and guarantee a perfect result.
Data Tool
Microsoft Power BIWhat's included
| Service Tiers |
Starter
$25
|
Standard
$50
|
Advanced
$120
|
|---|---|---|---|
| Delivery Time | 3 days | 4 days | 5 days |
Number of Revisions | 1 | 2 | 3 |
Number of Graphs/Charts | 5 | 10 | 15 |
Data Source Connectivity | |||
Web Embedding | |||
Interactive/Animated Visuals | - | - |
Frequently asked questions
2 reviews
(2)
(0)
(0)
(0)
(0)
This project doesn't have any reviews.
EW
Eric W.
Jun 1, 2026
Use a LinkedIn and google profile to complete 3 surveys approximately takes 10 minutes.
RK
Robert B K.
Mar 15, 2023
Rankmath SEO Help Needed
Sidra did very well from start to finish. She communicated well. Her research was impressive.
I look forward to working with her more in the future.
I look forward to working with her more in the future.
About Sidra
Microsoft Certified Power BI Developer | Dashboard & Data Viz Expert
100%
Job Success
High Point, United States - 1:36 pm local time
✦ What can I help with
— Power BI dashboards & interactive reports
— Microsoft Power BI data visualization & Power BI Embedded
— Excel dashboards, Excel data visualization & Excel design
— Power Query & Excel Power Query for data transformation
— Data analysis with SQL, Excel & Power BI
— End-to-end data analyst work: clean, model, visualize
— Data Entry
I love working on new projects and bringing ideas to life through data. Take a look at my work — and let's see if we're a great fit.
Steps for completing your project
After purchasing the project, send requirements so Sidra can start the project.
Delivery time starts when Sidra receives requirements from you.
Sidra works on your project following the steps below.
Revisions may occur after the delivery date.
Connect Power Bi to Data Source.
Transform and cleanse Data into Power Query