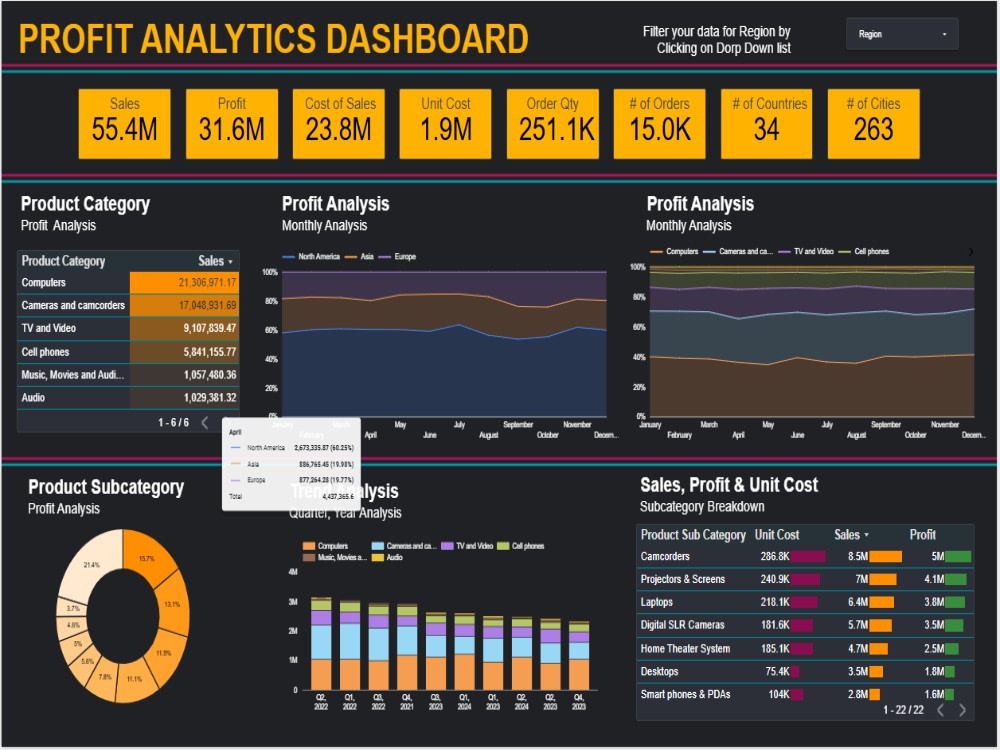
You will get Interactive Profit Analytics Dashboard in Looker Studio / Google Sheets
Top Rated
Top Rated
Project details
A professional Profit Analytics Dashboard that visualizes sales, profit, and cost trends across categories, regions, and time periods. It includes dynamic KPIs, interactive filters, and insightful charts for clear business performance tracking and decision-making.
Data Tool
Google SheetsWhat's included $100
These options are included with the project scope.
$100
- Delivery Time 1 day
- Number of Revisions 1
- Data Source Connectivity
- Web Embedding
- Interactive/Animated Visuals
192 reviews
(175)
(12)
(2)
(1)
(2)
This project doesn't have any reviews.
TB
Tobias B.
Jun 23, 2026
Data Analyst (Campaign Data Visualization & Tracking)
JW
Jay W.
Jun 16, 2026
Excel Automation Expert
Great and timely work as usual!
SH
Shanta H.
Jun 3, 2026
FBA & PBSP for K. Jardine
Mr. Syed is getting better and better at my tasks requests.
KA
Kholoud A.
Apr 20, 2026
Scraping data TO
TA
Teresa A.
Apr 11, 2026
FBA & PBSP
Thanks so much for all your help!
About Syed Mehtab
Excel & Google Sheets Automation Expert | Dashboards & Reports
97%
Job Success
Rawalpindi, Pakistan - 4:15 pm local time
I help businesses replace manual spreadsheets with automated dashboards, financial models, reporting systems, and data workflows using Excel, Google Sheets, Apps Script, VBA, Power Query, and Looker Studio.
If you are spending hours updating reports, cleaning messy files, copying data between sheets, or trying to understand business performance from scattered spreadsheets, I can help you build a clean system that saves time and reduces manual work.
What I can help you with:
• Excel dashboards, reports, formulas, pivot tables, Power Query, and VBA macros
• Google Sheets dashboards, formulas, Apps Script automation, and custom workflows
• Financial models, forecasting sheets, P&L trackers, budget vs actual reports, and pricing models
• Data cleaning, data consolidation, automated reporting, and refreshable spreadsheet systems
• Looker Studio dashboards connected with Google Sheets, GA4, Search Console, Shopify, ads data, and other live sources
• Business reporting systems for sales, operations, finance, e-commerce, agencies, and service businesses
Why clients hire me:
• 300+ Upwork projects completed
• Top Rated Plus freelancer
• Strong Excel, Google Sheets, dashboard, and financial reporting background
• Able to understand both the technical side and the business side of reports
• Clear communication, fast turnaround, and clean documentation
• Available for urgent fixes, one-time builds, and long-term reporting support
Tools I work with:
Excel, Google Sheets, Apps Script, VBA, Power Query, Power Pivot, Looker Studio, Power BI, SQL, QuickBooks, GA4, Search Console, Shopify, and Supermetrics.
I also have an accounting and financial reporting background, so I can support dashboards and spreadsheet systems related to bookkeeping, QuickBooks, P&L reporting, budget tracking, and financial analysis.
Steps for completing your project
After purchasing the project, send requirements so Syed Mehtab can start the project.
Delivery time starts when Syed Mehtab receives requirements from you.
Syed Mehtab works on your project following the steps below.
Revisions may occur after the delivery date.
Data Review & Requirement Confirmation
Review sales and cost data, confirm KPIs, and discuss dashboard structure (Sales, Profit, Cost, Region).
Dashboard Design & Development
Build a clean, interactive dashboard in Looker Studio including KPIs, charts, and region/category filters.